
Marketing reporting software
Marketing reporting software pulls your ad, analytics and CRM data into one report. Lemonado builds reports by asking and handles the follow-up. Databox suits KPI dashboards (free, then $71/mo), Looker Studio is free for Google data, and Supermetrics feeds Looker Studio from €39/mo.
By Theodor Lindfors, Founding Marketer, Lemonado
The short answer
Marketing reporting software pulls data from your ad platforms, analytics and CRM into one report or dashboard. The best options in 2026: Lemonado to build reports by asking and handle the follow-up, Databox for KPI dashboards (free, then $71/mo), Looker Studio for free DIY reports, Supermetrics or Funnel to feed data, and Power BI for analysts. Prices verified November 2026.
Lemonado is the AI co-worker for marketing. Connect Google Ads, Meta, LinkedIn, GA4 and Stripe, then ask for the report you need: "Weekly marketing report, spend, signups and CAC by channel, compared with last week." It builds it on live data, sends it to Slack every Monday, and answers the follow-up question when a number moves. During the beta, marketing teams ran 12,000+ tasks and managed $40M in ad spend with Lemonado.
A quick look at the marketing reporting tools
Eight marketing reporting tools, side by side. Most charge for something that grows with your team: users, data sources, accounts or rows of data.
 Lemonado
Looks at the data
- Best for
- In-house teams who want reports built by asking, and the follow-up done
- How you pay
- Credits for work done, unlimited seats
- Starts at
- See pricing
- Free plan
- 10-day trial, $150 in credits
- First problem
- Not a BI tool for a data team
 Databox
Makes reports
- Best for
- KPI dashboards and goals for a small team
- How you pay
- Per plan, capped by users and sources
- Starts at
- $71/mo billed yearly
- Free plan
- Yes, 1 user, 3 sources
- First problem
- Users and sources are capped on every plan
 Looker Studio
Makes reports
- Best for
- Free reports on Google data
- How you pay
- Free tool, paid connectors for other sources
- Starts at
- Free, connectors extra
- Free plan
- Yes
- First problem
- Meta, LinkedIn and TikTok need a paid connector, and you build every chart
 Supermetrics
Moves data
- Best for
- Getting ad data into Looker Studio, Sheets or Excel
- How you pay
- Per source, user and destination
- Starts at
- From €39/mo billed yearly
- Free plan
- No
- First problem
- A third data source leaves Starter
 Coupler.io
Moves data
- Best for
- Small teams who report in Google Sheets
- How you pay
- Per plan, by accounts and destinations
- Starts at
- From $24/mo billed yearly
- Free plan
- Yes, manual refresh
- First problem
- Starter is one user and one destination
 Funnel.io
Moves data
- Best for
- Teams with an analyst who want one governed data hub
- How you pay
- Plan + flexpoints, from $300/mo billed yearly
- Starts at
- From $300/mo billed yearly
- Free plan
- No
- First problem
- From $300/mo billed yearly before you build a single report
 Power BI
Makes reports
- Best for
- Companies on Microsoft with an analyst to build reports
- How you pay
- Pay per user
- Starts at
- $14/user/mo billed yearly
- Free plan
- Yes, but you can't share reports
- First problem
- Built for analysts, and ad data needs a connector
 Improvado
Makes reports
- Best for
- Enterprise teams who want the setup done for them
- How you pay
- Yearly contract, sold through a demo
- Starts at
- From $20,000/yr (MCP-only plan $100/mo)
- Free plan
- No
- First problem
- Priced and built for enterprise
Prices from each vendor's public pricing page, verified November 2026. Check against a quote before you buy.
Want the report built for you? Ask Lemonado for last week's marketing report and check it against yours.
What marketing reporting software does
Marketing reporting software collects data from the tools you market with (ad platforms, web analytics, CRM, ecommerce or billing) and turns it into reports and dashboards you can share. It saves the copy-paste between platforms and keeps everyone looking at the same numbers. You'll also see it called a marketing reporting platform or online marketing reporting tools.
The tools on this page do that in three ways. Dashboard tools (Databox, Looker Studio, Power BI) show the numbers once the data is connected. Data pipes (Supermetrics, Coupler.io, Funnel, Improvado) move the data into a dashboard, a sheet or a warehouse, and you build the report there. AI co-workers (Lemonado) build the report from a plain question, send it on a schedule and answer the follow-up questions.
A good in-house marketing report shows spend, results and cost per result by channel, the trend against last period, and one line on why the big numbers moved. Most teams also want pipeline or revenue next to ad spend, which is where single-platform reports fall short.
Why in-house teams outgrow their reporting tool
The dashboard is rarely the problem. The hours around it are: pulling, checking, explaining and waiting.
The dashboard shows what happened, not why
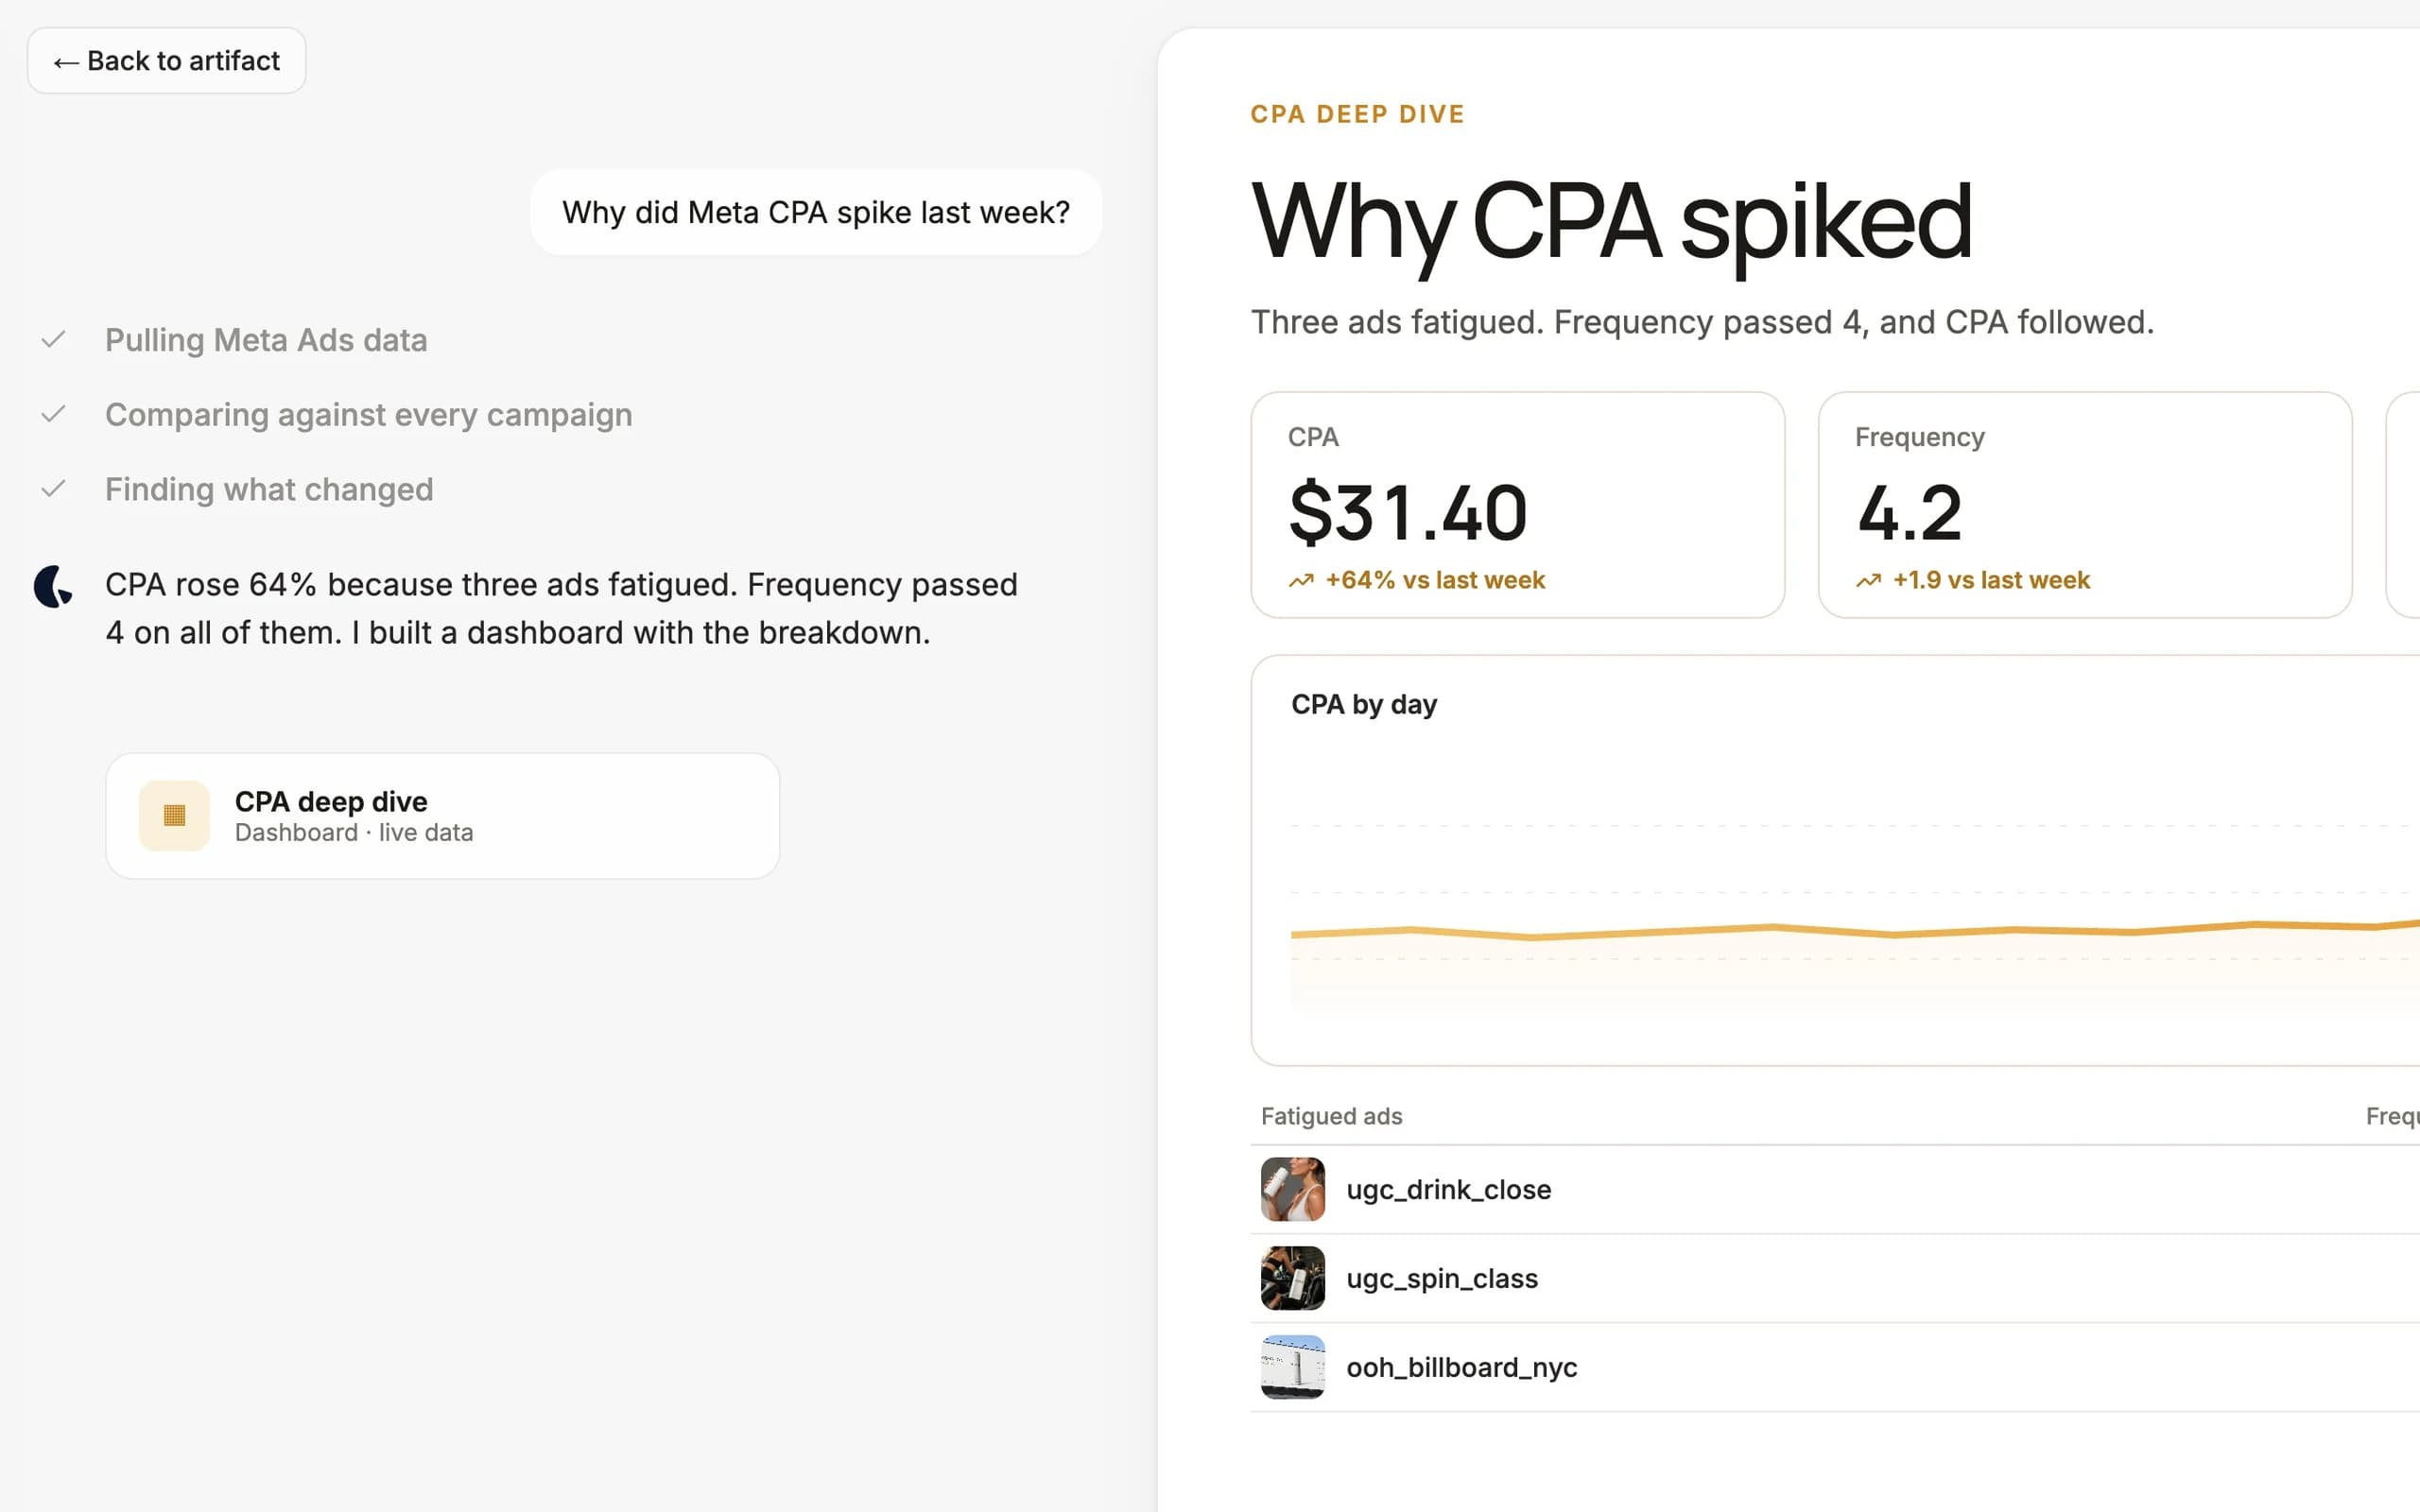
Meta CPA is up 30% this week. The dashboard says so. Someone still has to open Ads Manager, GA4 and the CRM, find the cause and write it up before Monday's meeting. That part takes the time, and it's the same work every week.
Four tools, four numbers
Meta says 120 conversions, GA4 says 80, the CRM says 45. Without one set of definitions, the weekly review turns into a debate about which number is right instead of what to do next.
Every new question waits for the data person
Most reporting tools are fine until someone asks a question the dashboard wasn't built for. Then it's a ticket to whoever owns the data, and the answer arrives after the budget decision was made.
The tools
This one does the work

Lemonado is the AI co-worker for marketing. It connects natively to Google Ads, Microsoft Ads, Meta Ads, LinkedIn, TikTok, GA4, Search Console, Google Sheets and Stripe, and to 3,000+ tools in total. Ask "Build our weekly marketing report: spend, signups and CAC by channel, compared with last week" and it builds it in Studio on live data. Set a routine to send it to Slack every Monday, and another to flag a CPA spike the day it happens. Ask why a number moved and it digs through the accounts for the answer. When you ask it to act, like moving budget between campaigns, the change waits for your approval.
Best for: In-house marketing teams who spend more time pulling numbers than deciding what to do with them.
Where it falls down: It isn't a BI tool for your data team, and it won't replace a warehouse if every row must live there. It's newer than the other tools here, with fewer independent reviews so far.
- Your team rebuilds the same report every week, or waits on a data person for answers.
 In Claude
 In ChatGPT
These tools make dashboards
Databox
Databox builds KPI dashboards and scorecards with goals, alerts and an AI analyst called Genie. Connect your ad platforms, analytics and CRM, pick metrics, and share a dashboard the whole team checks. It has a real free plan.
Best for: Small in-house teams who want a KPI dashboard with goals, live this week.
Where it falls down: Users and data sources are capped on every plan, so a growing team moves up tiers fast. It shows the numbers well, and someone still works out what to do about them.
- You want one shared dashboard of KPIs and goals, and the team will check it.
Looker Studio
Looker Studio (Google now calls it Data Studio) is Google's free dashboard tool. Google Ads, GA4, Search Console and Sheets connect for free. Meta, LinkedIn and TikTok need a paid partner connector like Supermetrics, Coupler.io or Porter.
Best for: One marketer who likes building and has a small budget.
Where it falls down: You build, fix and update every chart yourself. When a connector breaks the morning of the board meeting, so does the report.
- Your budget is zero, most of your data is Google, and you enjoy building.
Power BI
Power BI is Microsoft's business intelligence tool for company-wide reporting and big data models. Marketing data usually comes in through a third-party connector, and an analyst builds the reports.
Best for: Companies already on Microsoft with an analyst who owns reporting.
Where it falls down: It's built for analysts, not marketers. On the free plan you can't share reports, so most teams pay per user.
- Marketing reports have to sit next to finance and sales in the company BI tool.
These tools move your data into a dashboard or sheet
Supermetrics
Supermetrics sends ads and analytics data into Looker Studio, Google Sheets, Excel, Power BI, warehouses and AI chats. It's the most common way to get Meta and LinkedIn data into Looker Studio.
Best for: Teams who already report in Looker Studio or Sheets and need more sources in it.
Where it falls down: It moves the data. You still build the report. Starter covers 2 sources and 1 user, so the bill grows with every source and seat.
- Your reports already live in Looker Studio or Sheets and work fine.
Coupler.io
Coupler.io pulls data from 400+ sources into Google Sheets, Looker Studio and other destinations on a schedule. There's a free plan with manual refresh.
Best for: Small teams who live in Google Sheets.
Where it falls down: Starter is one user and one destination with daily refresh. Like any pipe, it fills the sheet and leaves the analysis to you.
- Your marketing report is a Google Sheet and you want it to fill itself.
Funnel.io
Funnel collects marketing data from 600+ sources, cleans it into one model and sends it to BI tools, warehouses and dashboards. Funnel AI and an MCP connection are included.
Best for: Mid-size and larger teams with an analyst who want one governed data hub.
Where it falls down: It starts at $300/mo billed yearly, with flexpoints metering usage on top, and you still need a BI tool and someone to build the reports.
- You have a data person and want marketing data clean before it reaches BI.
Built for enterprise
Improvado
Improvado is an enterprise marketing data platform with an AI agent on top. It connects 1,000+ sources, models the data and handles setup with a services team. An MCP-only plan lets you query the data from your own AI assistant.
Best for: Large marketing orgs that want data, governance and setup handled for them.
Where it falls down: The full platform starts at $20,000 a year and is bought through a demo, which is more than most in-house teams need.
- You run a large marketing org with a data budget and a long list of sources.
Other names you'll see. Triple Whale and Northbeam are built for ecommerce attribution and profit, not general marketing reporting. Your CRM's own reports cover the pipeline side. GA4 on its own shows website and conversion data, but not your ad spend across platforms.
Reporting to clients? That's a different job, priced per client. See agency reporting software, and PPC reporting software for paid search reports.
Where Lemonado fits in an in-house team
The same reporting job, done by asking. Four things in-house teams hand to Lemonado in the first week.
The Monday report, built once and sent every week
Ask for it in plain words, check it against last week's numbers, then have it land in Slack or email every Monday morning.
One number for every channel
Google Ads, Meta, LinkedIn, GA4 and Stripe in one report, with the same definition of a conversion and CAC every time.
Answers without a ticket to the data team
"Why did signups drop on Tuesday?" gets an answer on live data in minutes, with the chart that shows it.
A heads-up before budget burns
A routine watches spend and CPA every day and posts to Slack when something moves, so you hear about it before the weekly review.
- tasks run by marketing teams during the beta
- 12,000+tasks run by marketing teams during the beta
- in ad spend managed with Lemonado during the beta
- $40Min ad spend managed with Lemonado during the beta
Weekly client reports with insights, across 50+ clients.
“What used to take me an hour or two now takes around 10 minutes.”
 Cobus TaylorPerformance Lead, Stitch (50+ clients)1–2h10 minper report
How to choose marketing reporting software
Answer four questions before you book a demo.
Who builds the reports? If you have an analyst, a pipe plus Looker Studio or Power BI gives them full control. If nobody on the team wants to build, pick a tool that builds for you.
Which sources do you need? List every ad platform, your analytics, CRM and billing. Check each one is a native connector, not a paid add-on or a CSV upload.
How many people need access? Per-user pricing (Power BI, Supermetrics, Databox's capped plans) adds up as more of the team wants in. Lemonado has unlimited seats on every plan.
What happens after the report? If the report goes out and nobody acts on it, the tool isn't the bottleneck. Look for alerts, written summaries and a way to ask why a number moved.
Free marketing reporting tools
You can do a lot of marketing reporting for free if most of your data is Google and someone is happy to build.
| Tool | What's free | Where the free plan stops |
|---|---|---|
| Looker Studio | Unlimited reports on Google Ads, GA4, Search Console and Sheets | Meta, LinkedIn and TikTok need a paid connector |
| Databox | 1 user and 3 data sources | A fourth source means Analyst at $71/mo billed yearly. A second user means Team Core at $199/mo |
| Coupler.io | 1 account and 1 destination, manual refresh, 100 rows per run | Scheduled refresh starts at $24/mo billed yearly |
| Power BI | Build reports for yourself | Sharing reports needs Pro at $14 per user a month |
| Lemonado | 10-day trial with $150 in credits, no card | Then a paid plan. See pricing |
For advanced reporting on a zero budget, the usual stack is Looker Studio for the dashboards, GA4 for site data and a free connector tier for one ad platform. It works until you need a second platform or someone else has to maintain it.
AI marketing reporting tools
Almost every tool here added AI in 2026, and they mean different things by it.
AI summaries inside a dashboard. Databox has Genie, Funnel has Funnel AI, and Supermetrics plans include AI credits. They explain the numbers on the dashboard you already built.
Your data in ChatGPT or Claude. Supermetrics, Funnel and Improvado (on its $100/mo MCP-only plan) connect your marketing data to the AI assistant you already use. You do the asking, and every chat starts from the data, not from your team's goals and history.
An AI co-worker that does the work. Lemonado connects your stack, remembers your metrics and goals, builds reports and dashboards from a plain question, runs routines on a schedule and acts with your approval. If you're looking for an AI tool for marketing reporting that saves the hours and not just the clicks, that's the difference to test.
When Lemonado is not the right pick
If your company already runs on Power BI with an analyst who owns marketing data, add a connector and keep it. If one shared KPI dashboard is all the team needs, Databox does it for less. If your budget is zero and your data is mostly Google, Looker Studio is free. And if you need every row in your own warehouse first, Funnel or Improvado is built for that.
How to start with Lemonado
Connect your ad platforms and GA4
Add your CRM or Stripe if the report covers pipeline or revenue.
Ask for last week's marketing report
Check it against the report you made by hand. Fix anything that's off by telling it what's wrong.
Add one routine
Have it send the report to Slack every Monday, or flag a CPA spike the day it happens.
Common questions
Marketing reporting software pulls data from your ad platforms, analytics and CRM into one report or dashboard, keeps it up to date and shares it with your team on a schedule.
Some tools only move the data (Supermetrics, Funnel), some show it (Databox, Looker Studio, Power BI), and AI co-workers like Lemonado build the report and answer questions about it.
Lemonado for reports built by asking, Databox for KPI dashboards, Looker Studio for free reports on Google data, Supermetrics or Coupler.io to feed Looker Studio and Sheets, Funnel or Improvado for a governed data hub, and Power BI for analysts.
Looker Studio is free and connects Google Ads, GA4 and Search Console. Databox has a free plan with 1 user and 3 sources, and Coupler.io has a free plan with manual refresh.
Power BI is free for reports only you see. Lemonado has a 10-day trial with $150 in credits and no card.
Yes. Lemonado is an AI co-worker for marketing: connect your ad platforms and analytics, ask for a report in plain words, and it builds it on live data and sends it on a schedule.
Databox, Funnel and Supermetrics also add AI summaries or chat to their own dashboards and pipes.
Automated marketing reporting means the report builds and sends itself on a schedule, with data pulled from each platform automatically instead of copied by hand.
The next step is automating what comes after the report: a written summary of what changed, alerts when a number moves, and someone, or something, acting on it.
Spend, results and cost per result by channel, the trend against the last period, and a short note on why the biggest numbers moved and what you'll do next.
Add pipeline or revenue next to ad spend if leadership reads it.
Yes, in all of them, but how differs. Looker Studio and Power BI let you build anything if you have the time. Databox uses templates and a builder. Lemonado builds a custom report from a plain description.
Marketing reporting software is for a team reporting on its own marketing. Client reporting software is for agencies sending branded reports to many clients, usually priced per client.