Every platform in one view
Meta, Google, TikTok, LinkedIn, Pinterest and Snapchat ads sit side by side, with the same numbers for each.
Lemonado scores the hook, fatigue and results of every ad on Meta, Google, TikTok, LinkedIn, Pinterest and Snapchat, side by side. Ask why one ad beats another and get the answer from your own numbers.










Why did After yoga win?
The first three seconds hold. People see the can in a real class, not a studio. That is why the hook is 86 and ROAS is 4.8x. Keep the budget here.
Video retention
Views and clicks
Hook
86
ROAS
4.8x
Spend
$12.1k
Hook rate
Share who stay after 3 seconds.
ROAS
4.8x
ROI
3.2x
Spend
$12.1k
An ad analysis tool shows you how each of your ads is doing and why. It pulls your ad results into one view, then breaks them down by the ad itself: the video, the image, the opening seconds, the copy. That is what people mean by ad creative analysis.
Many teams don't run ads on one platform anymore. The same idea goes out on Meta, TikTok and Google, often LinkedIn too. A good ad analysis tool lets you look at all of them together, so you can see if a winner on one platform is also a winner on the next.
Meta, Google, TikTok, LinkedIn, Pinterest and Snapchat ads sit side by side, with the same numbers for each.
Hook score, fatigue, head to head comparisons and audience breakdowns for every creative.
Ask why an ad wins or stops working, and the AI co-worker explains it from your live data.
From hours to 10 minutes.
What used to take me an hour or two, building reports and pulling together weekly insights, now takes around 10 minutes. Hours back in my week for strategy instead of data wrangling.
The CEO had no clue why they'd had a record-breaking month.
I went into Lemonado, typed a prompt, and had his answer in 5 minutes. Facebook, Google, seasonality, year-over-year, a two-month forecast. Before Lemonado, that's three hours of digging.
The whole team uses Lemonado
Lemonado is wildly loved and adopted at Nofence. It powers our Claude, runs our reporting (no more Looker) and everyone from the board to marketing team rely on it.
Like having an extra colleague.
As a performance marketing agency, we save time and raise the quality of our work by running it through Lemonado. It's almost like an extra colleague, keeping tabs on budgets and results.









Each of these answers part of the question. None of them answers the whole thing, and none of them talk to each other.
Good numbers, but only for that platform. Comparing Meta to TikTok means two tabs and a spreadsheet.
Shows hooks and fatigue, but often for only some of your platforms. Your Google, LinkedIn or Pinterest ads can get left out.
Shows what competitors run and for how long. It doesn't tell you why the ad works or what to try next.
Lemonado puts your ads from all six platforms and your competitors' ads in one place, with an AI co-worker that reads all of it. One question gets you an answer that covers every platform.
See the Creatives workspaceLook inside each ad, not just at its results. See what hooks people, where they stop watching, and what your competitors run.
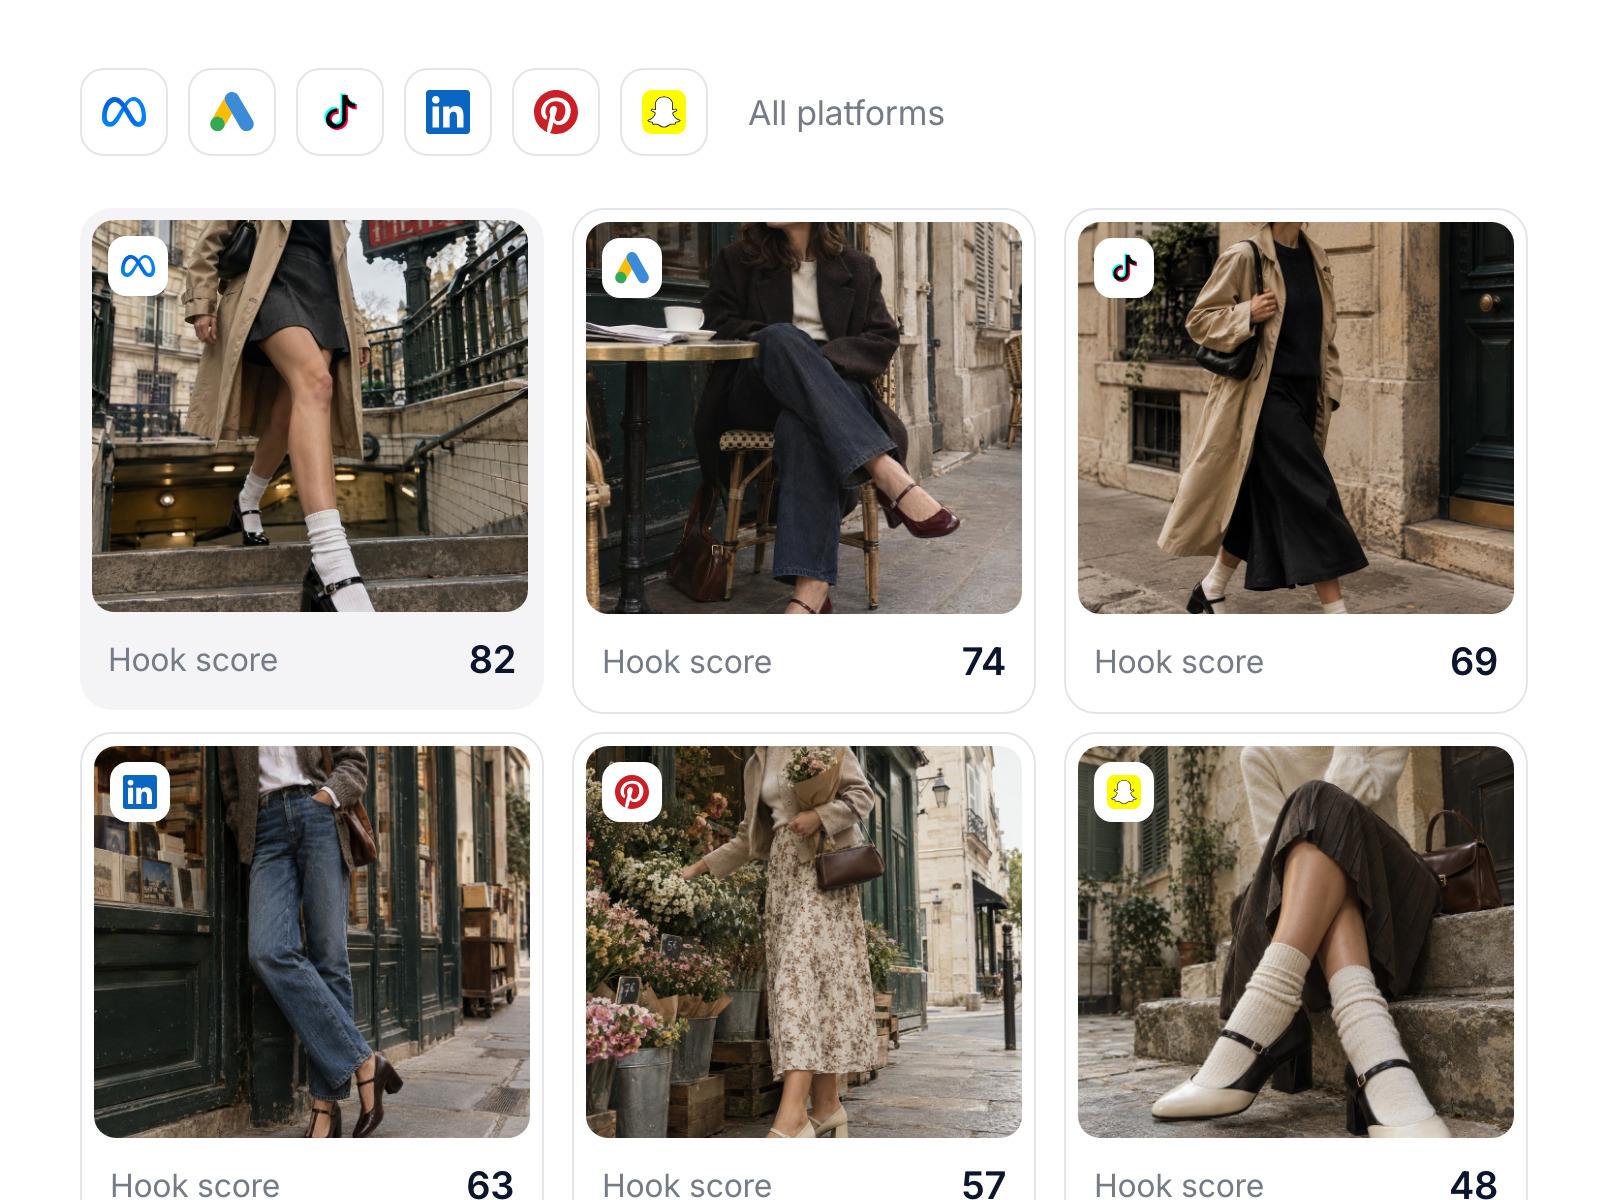
Your ads from Meta, Google, TikTok, LinkedIn, Pinterest and Snapchat sit in one grid. Each one gets a hook score, so you compare them on the same numbers.
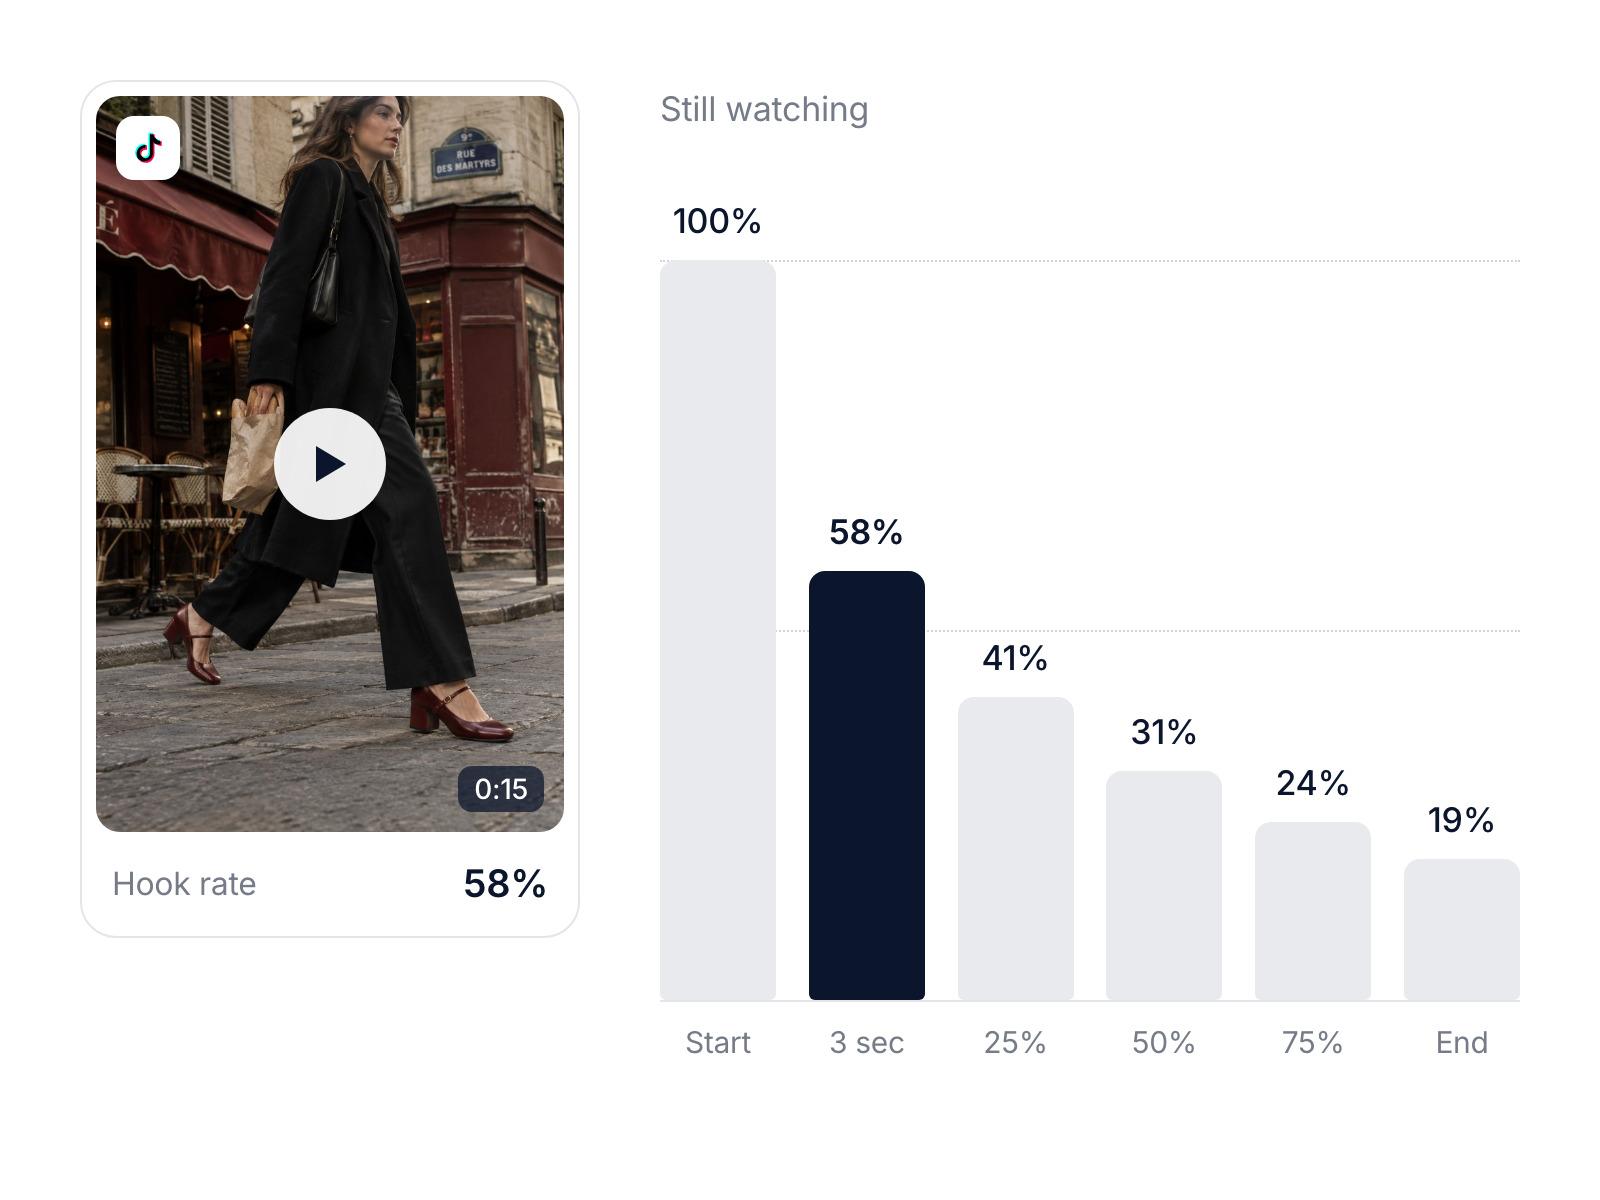
Open any video ad to see how many people watch past the first 3 seconds, then to 25%, 50%, 75% and the end. You see which part of the video loses people.
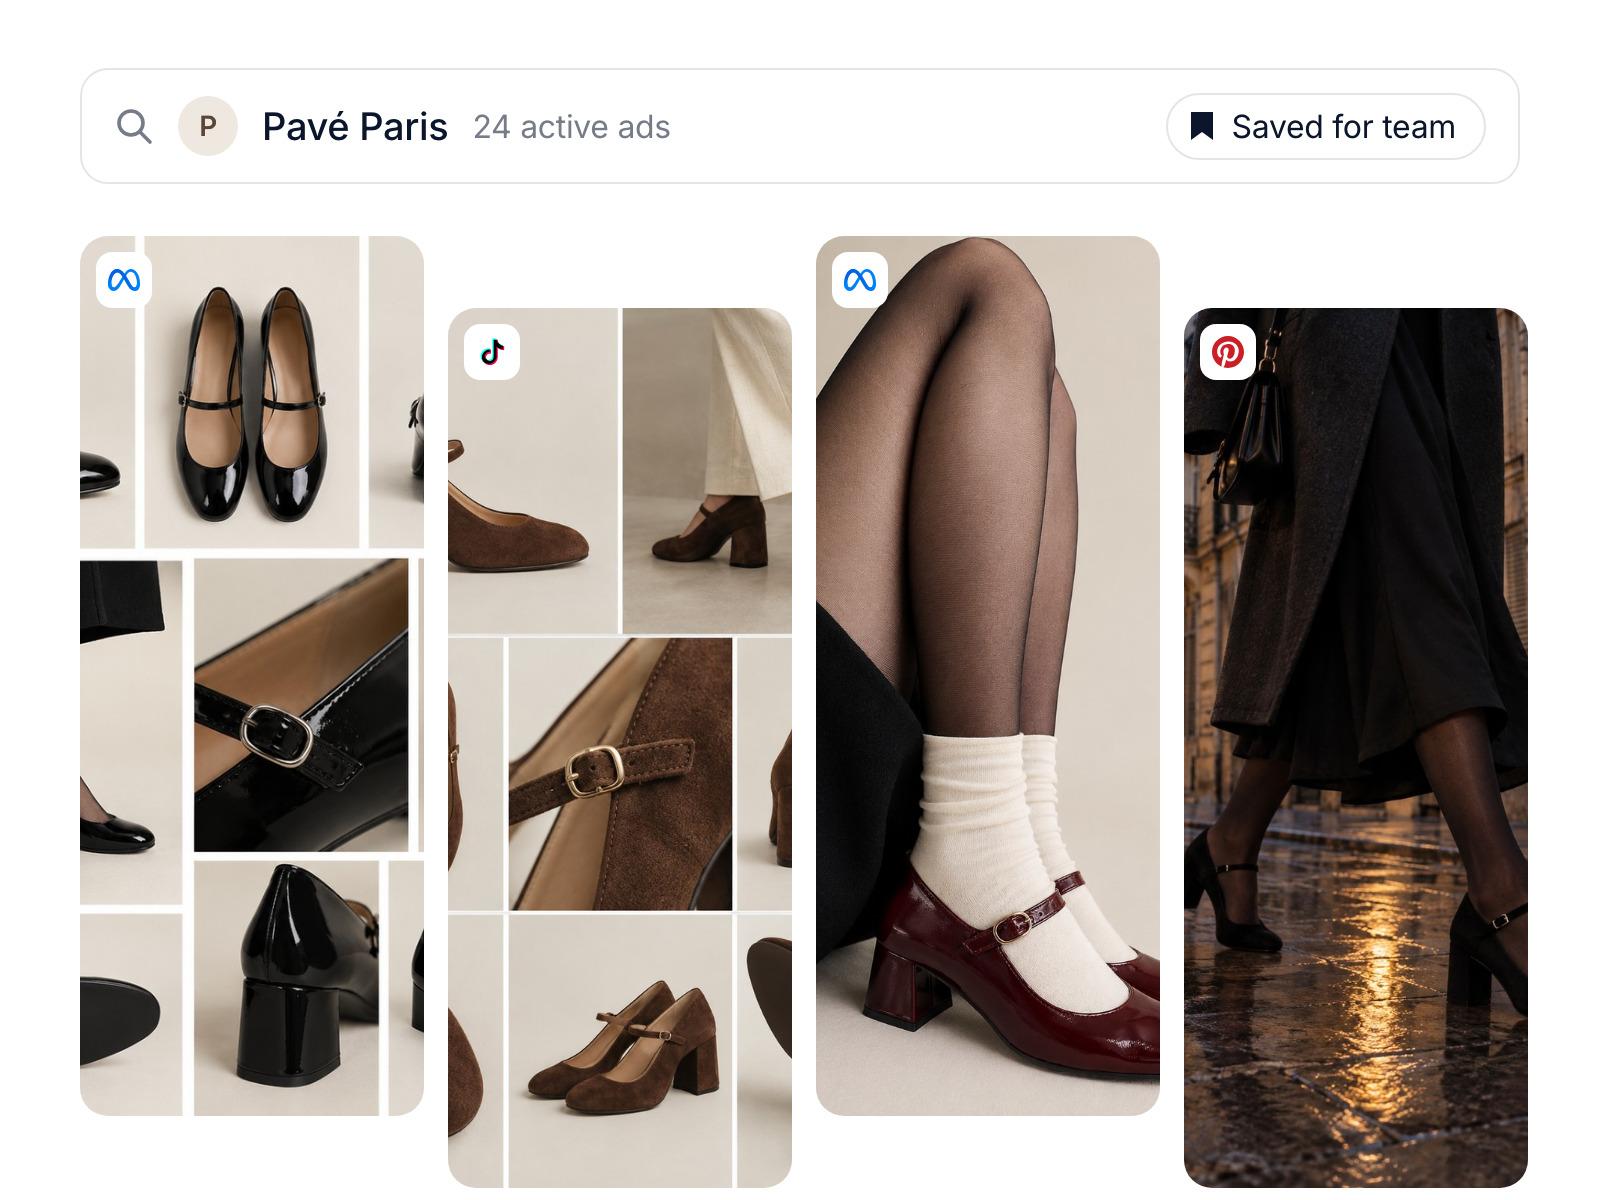
Look up a competitor in Discover and see the ads they run right now. Save them as a report your team and the AI co-worker can work from.
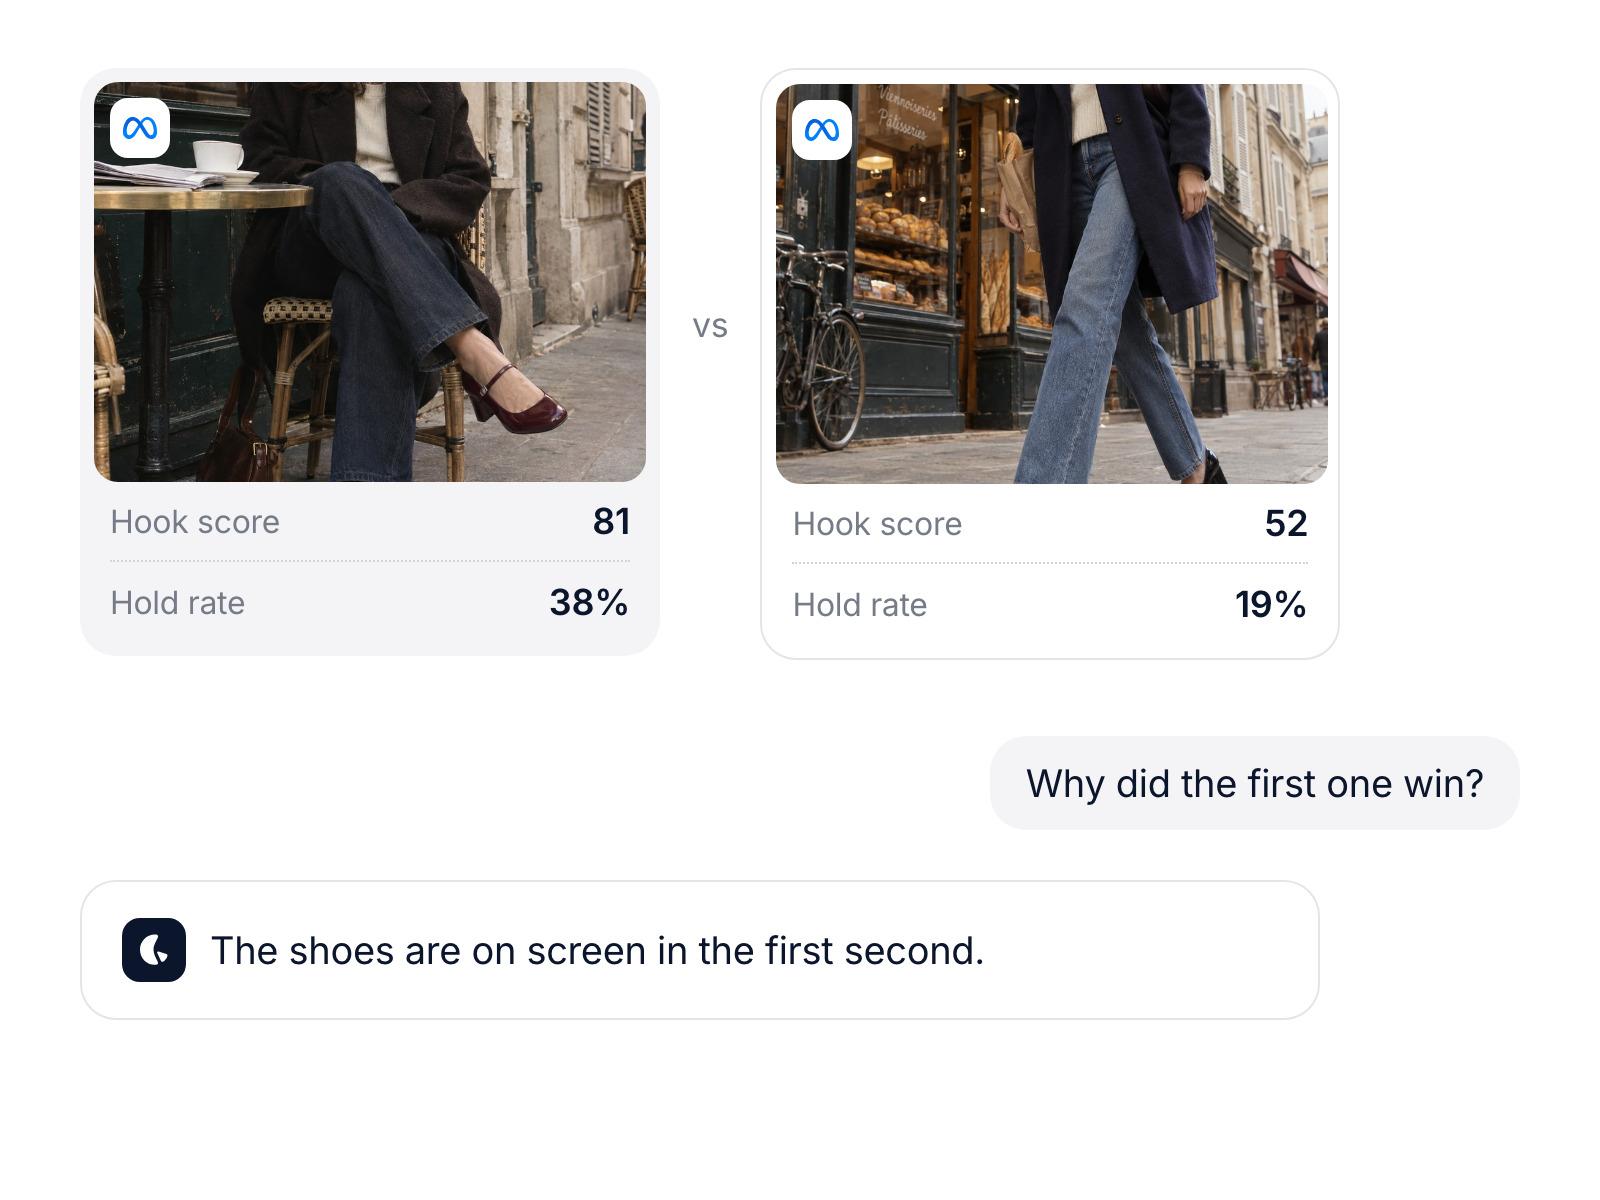
Pick two ads and ask why one did better. The AI co-worker compares the hook, how long people watched and the results, then tells you what made the difference.
An answer about your ads is only useful if you can check it. Lemonado shows the ads and the rows it used.
Compare our creator-to-camera openings with product close-ups on TikTok and Meta this month.
Query executed against your live data
select platform, hook_type, count(*) as ads,
  avg(hook_score) as hook_score, sum(spend)/sum(conversions) as cpa
from creative_performance
where date >= date_trunc('month', current_date)
  and platform in ('tiktok', 'meta')
group by 1, 2
order by platform, hook_score desc;
Source rows
The two platforms want different openings. On TikTok, ads that open with a creator talking to camera hook much better than product close-ups, and cost about a third less per sale. On Meta it flips: product close-ups hook better and convert cheaper. Brief more creator openings for TikTok, and keep product-first openings for Meta.
Every number comes from your connected ad accounts. Open any row to see the ads behind it, or compare two of them head to head.
Ask it something real.
Try for freeThree shifts worth knowing before you pick an ad analysis tool.
With Meta's Advantage+ audience, the age, gender and interests you set are treated as suggestions, and Meta's system decides who sees the ad. That puts more weight on the ad itself, so you need to know which hooks and formats work.
The same concept now runs on Meta, TikTok, YouTube and more at once. Looking at one platform at a time hides what's working across all of them.
Seeing that an ad won is no longer enough. Teams want a clear reason why, and a next step they can brief, without digging through tabs.
Meta (Facebook and Instagram), Google (including YouTube), TikTok, LinkedIn, Pinterest and Snapchat. You see ads from all of them in one place, with the same metrics, so you can compare them side by side.
Lemonado also connects to 3,000+ other tools, like GA4, Shopify, Stripe and HubSpot. That lets you tie an ad to sales, not only clicks.
Yes. For each video ad you see the hook rate, hold rate, average watch time and how many people reach 25%, 50%, 75% and 100%. You also see where viewers drop off.
You can put two ads side by side, then ask Lemonado why one keeps people watching longer.
Yes. Discover lets you find competitor ads and save them as reports your team and the AI co-worker can work from. It works in the free trial, even before you connect any ad accounts.
Lemonado reads why their ads work: the hooks, the angles, the offers, who's on camera and the landing pages.
Ad analysis looks at results like spend, clicks, CPA and ROAS for a campaign or ad. Creative analysis looks at the ad itself: the hook, the format, the message and who's in it. Lemonado does both in one place, so you can see which part of the ad moved the number.
No. Lemonado analyzes your ads and your competitors' ads and tells you what's working and why. Your team uses that to write the next brief.
Yes. You get $150 in credits to start, for up to 10 days. No card needed.
Shoot us an email at hello@lemonado.io.
Try for freeConnect your data to AI and free your team from reporting and busywork.
Try for free