Combine data from different sources
Add a table widget
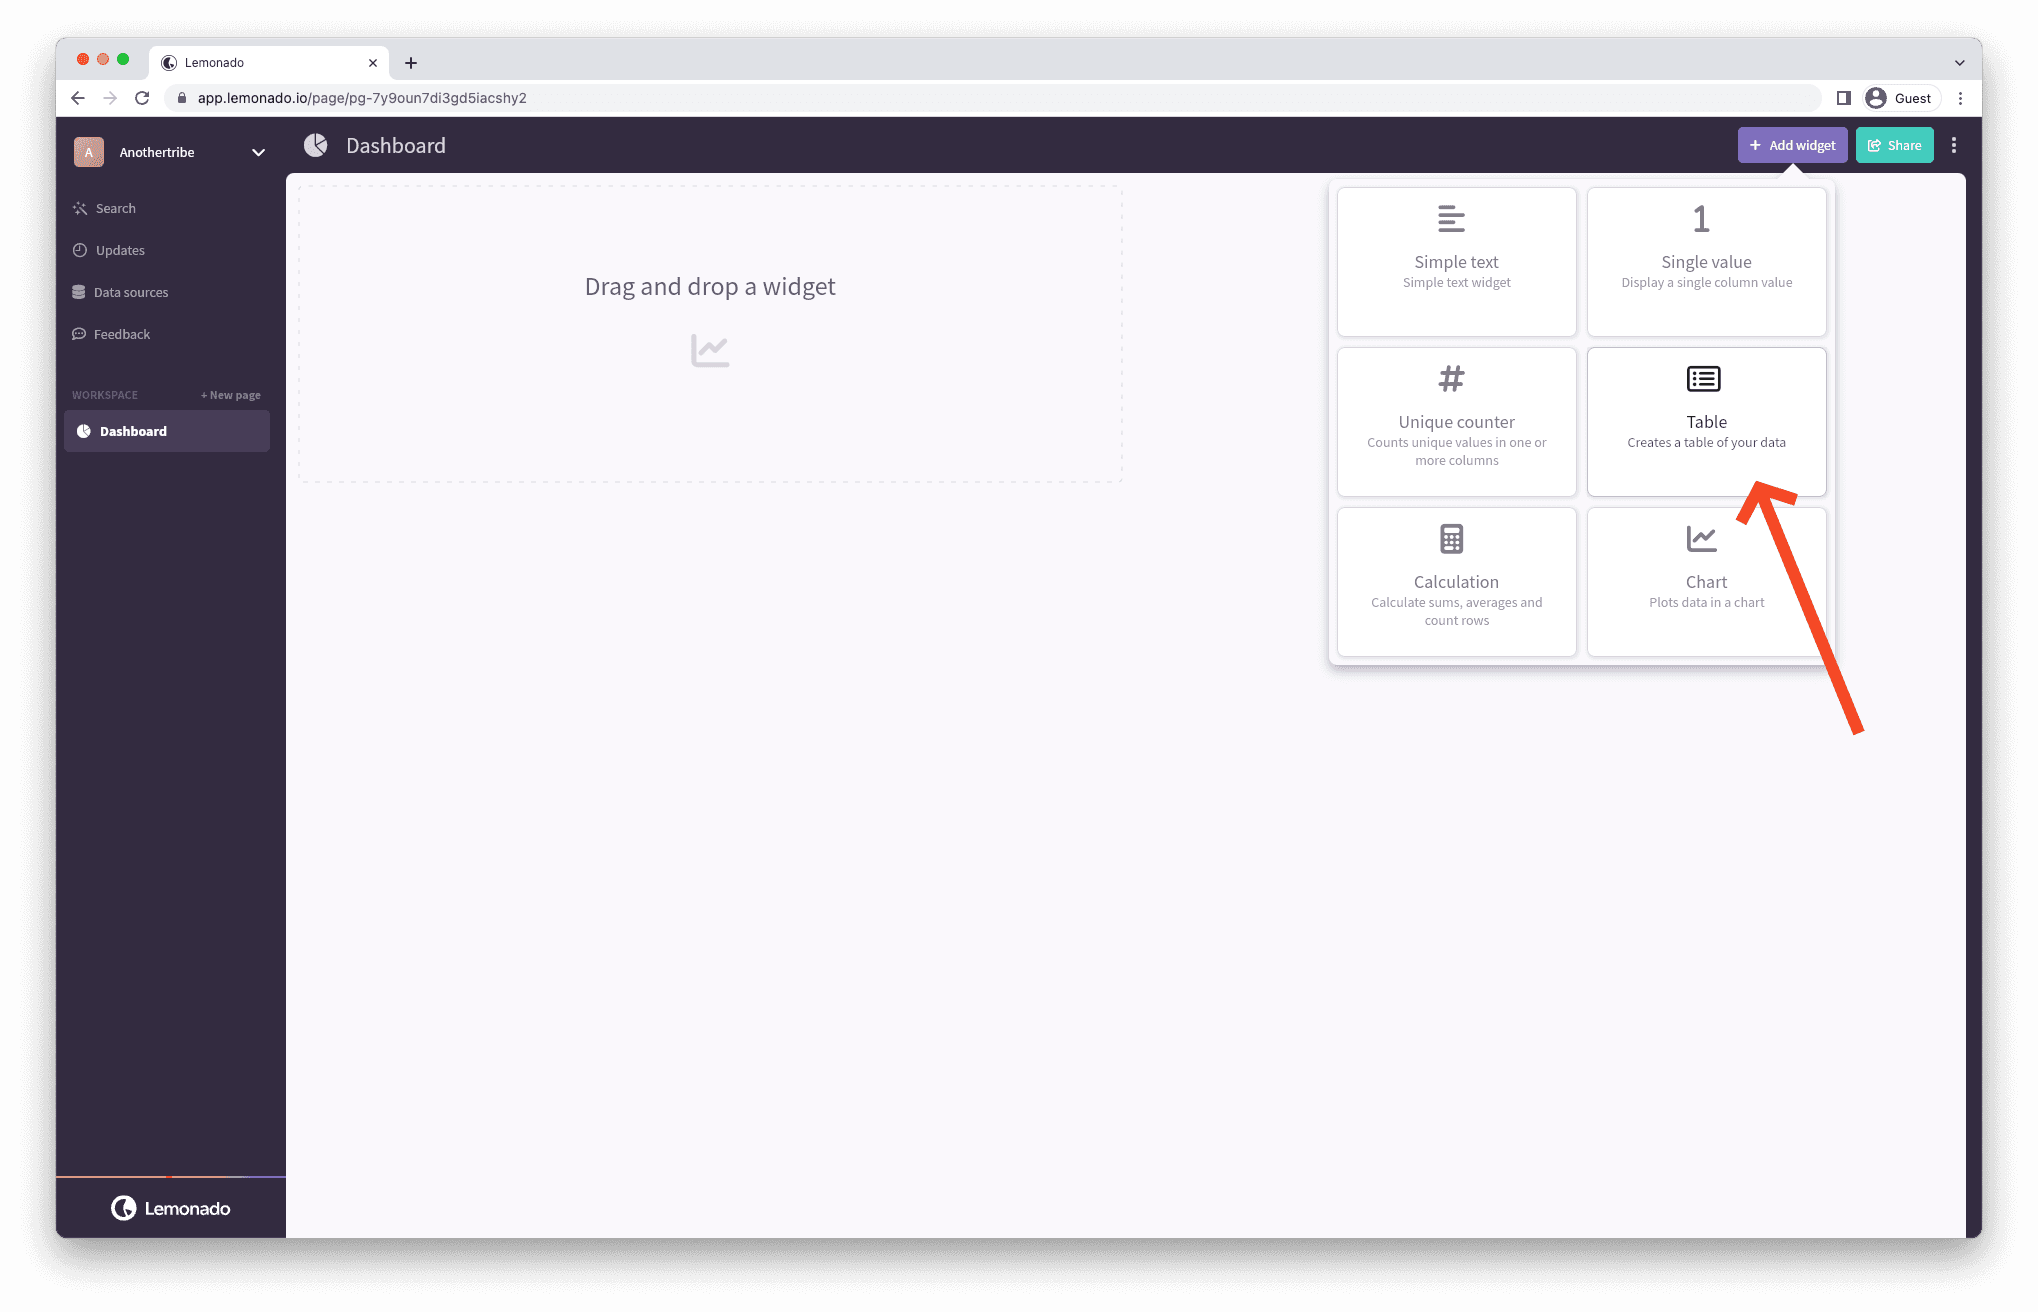
Start by adding a table widget to your dashboard.
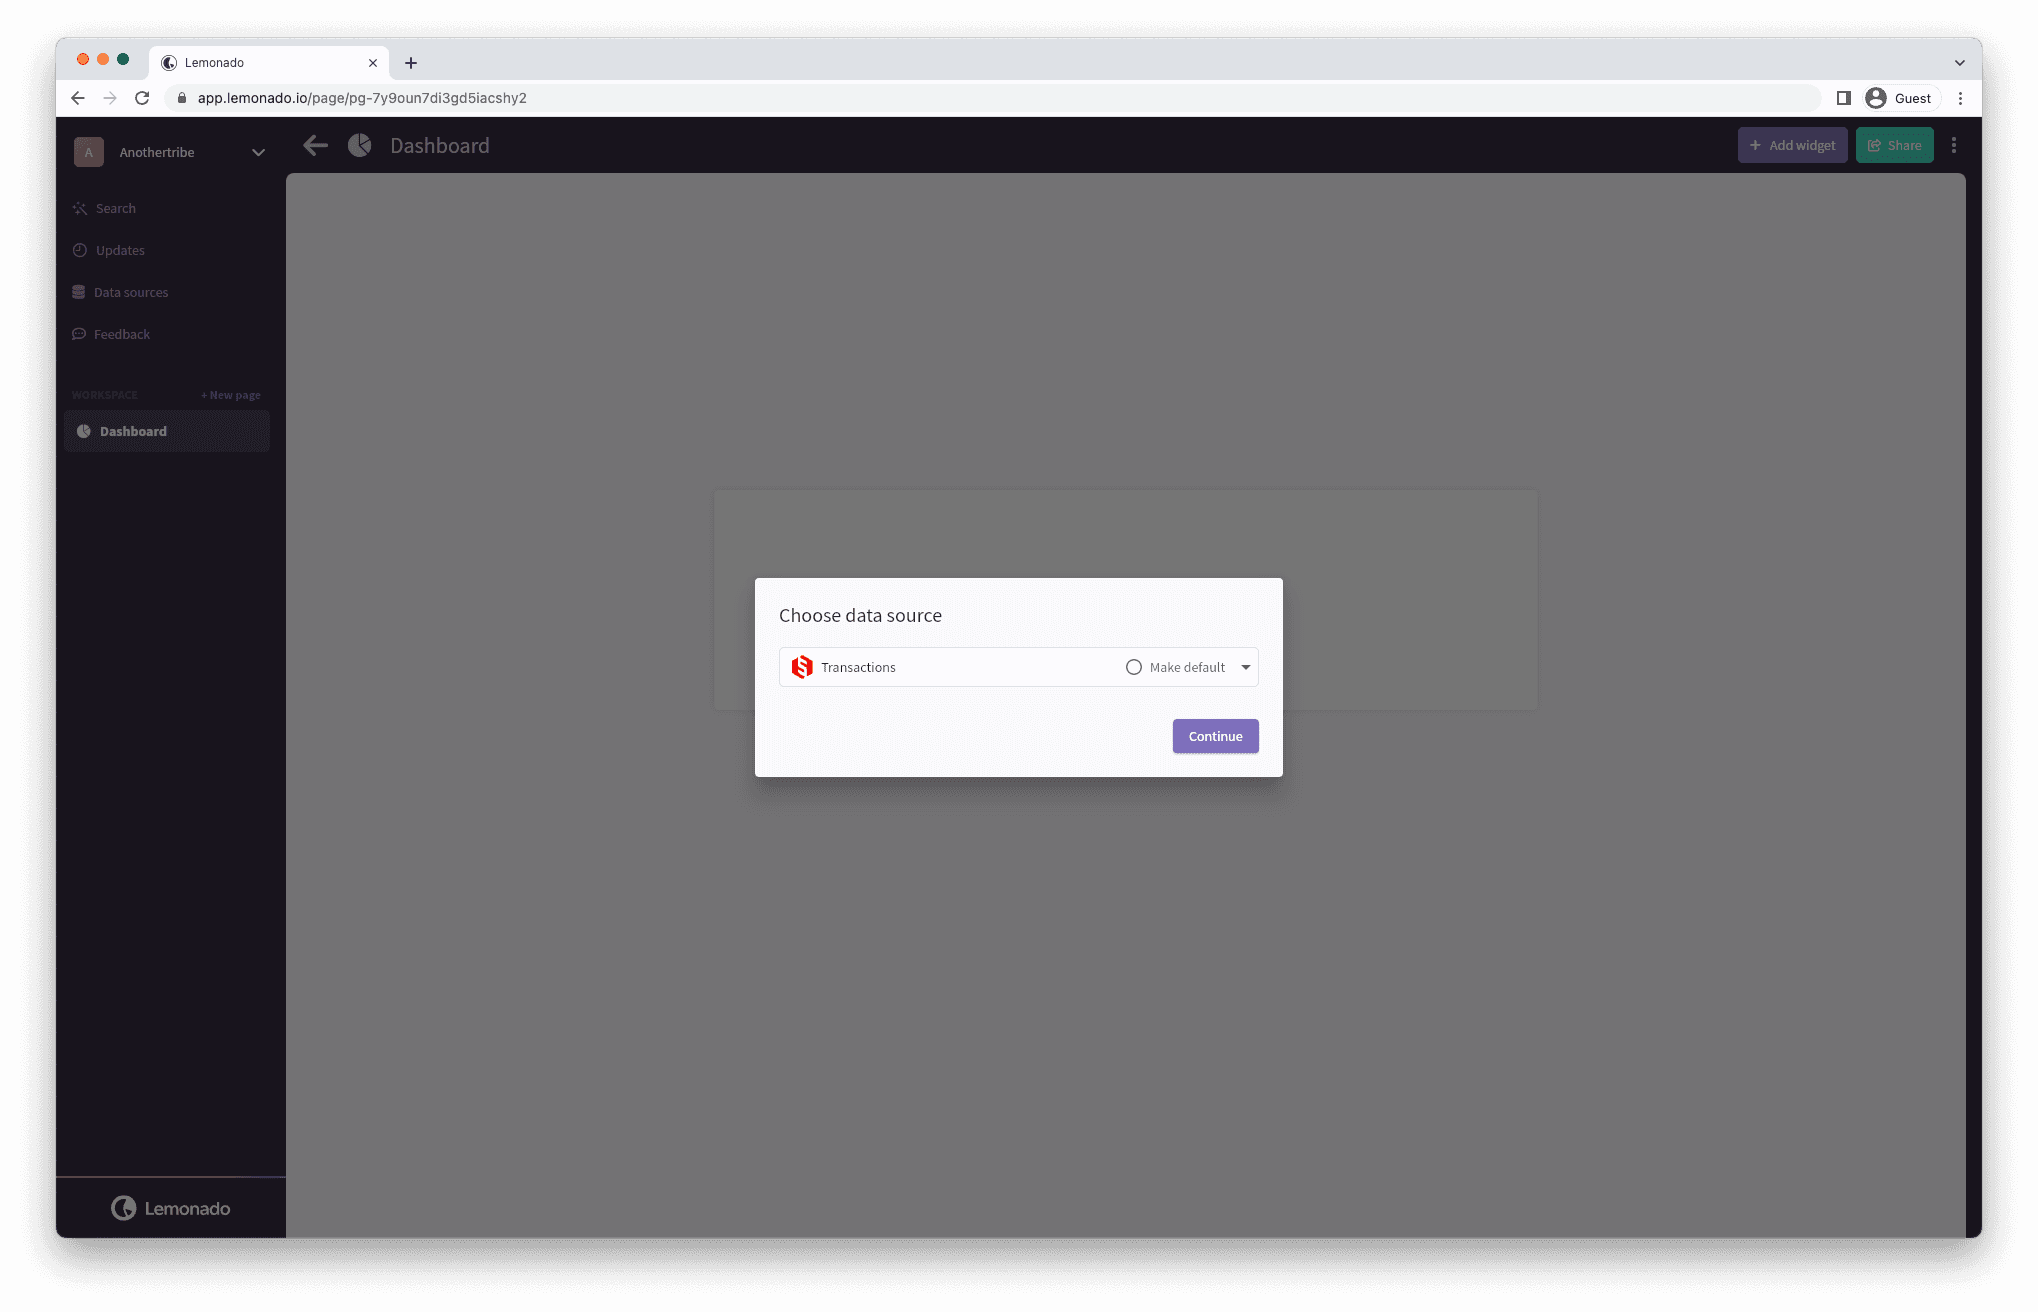
Then select the datasource. For this example we'll use transactions.
Add related columns
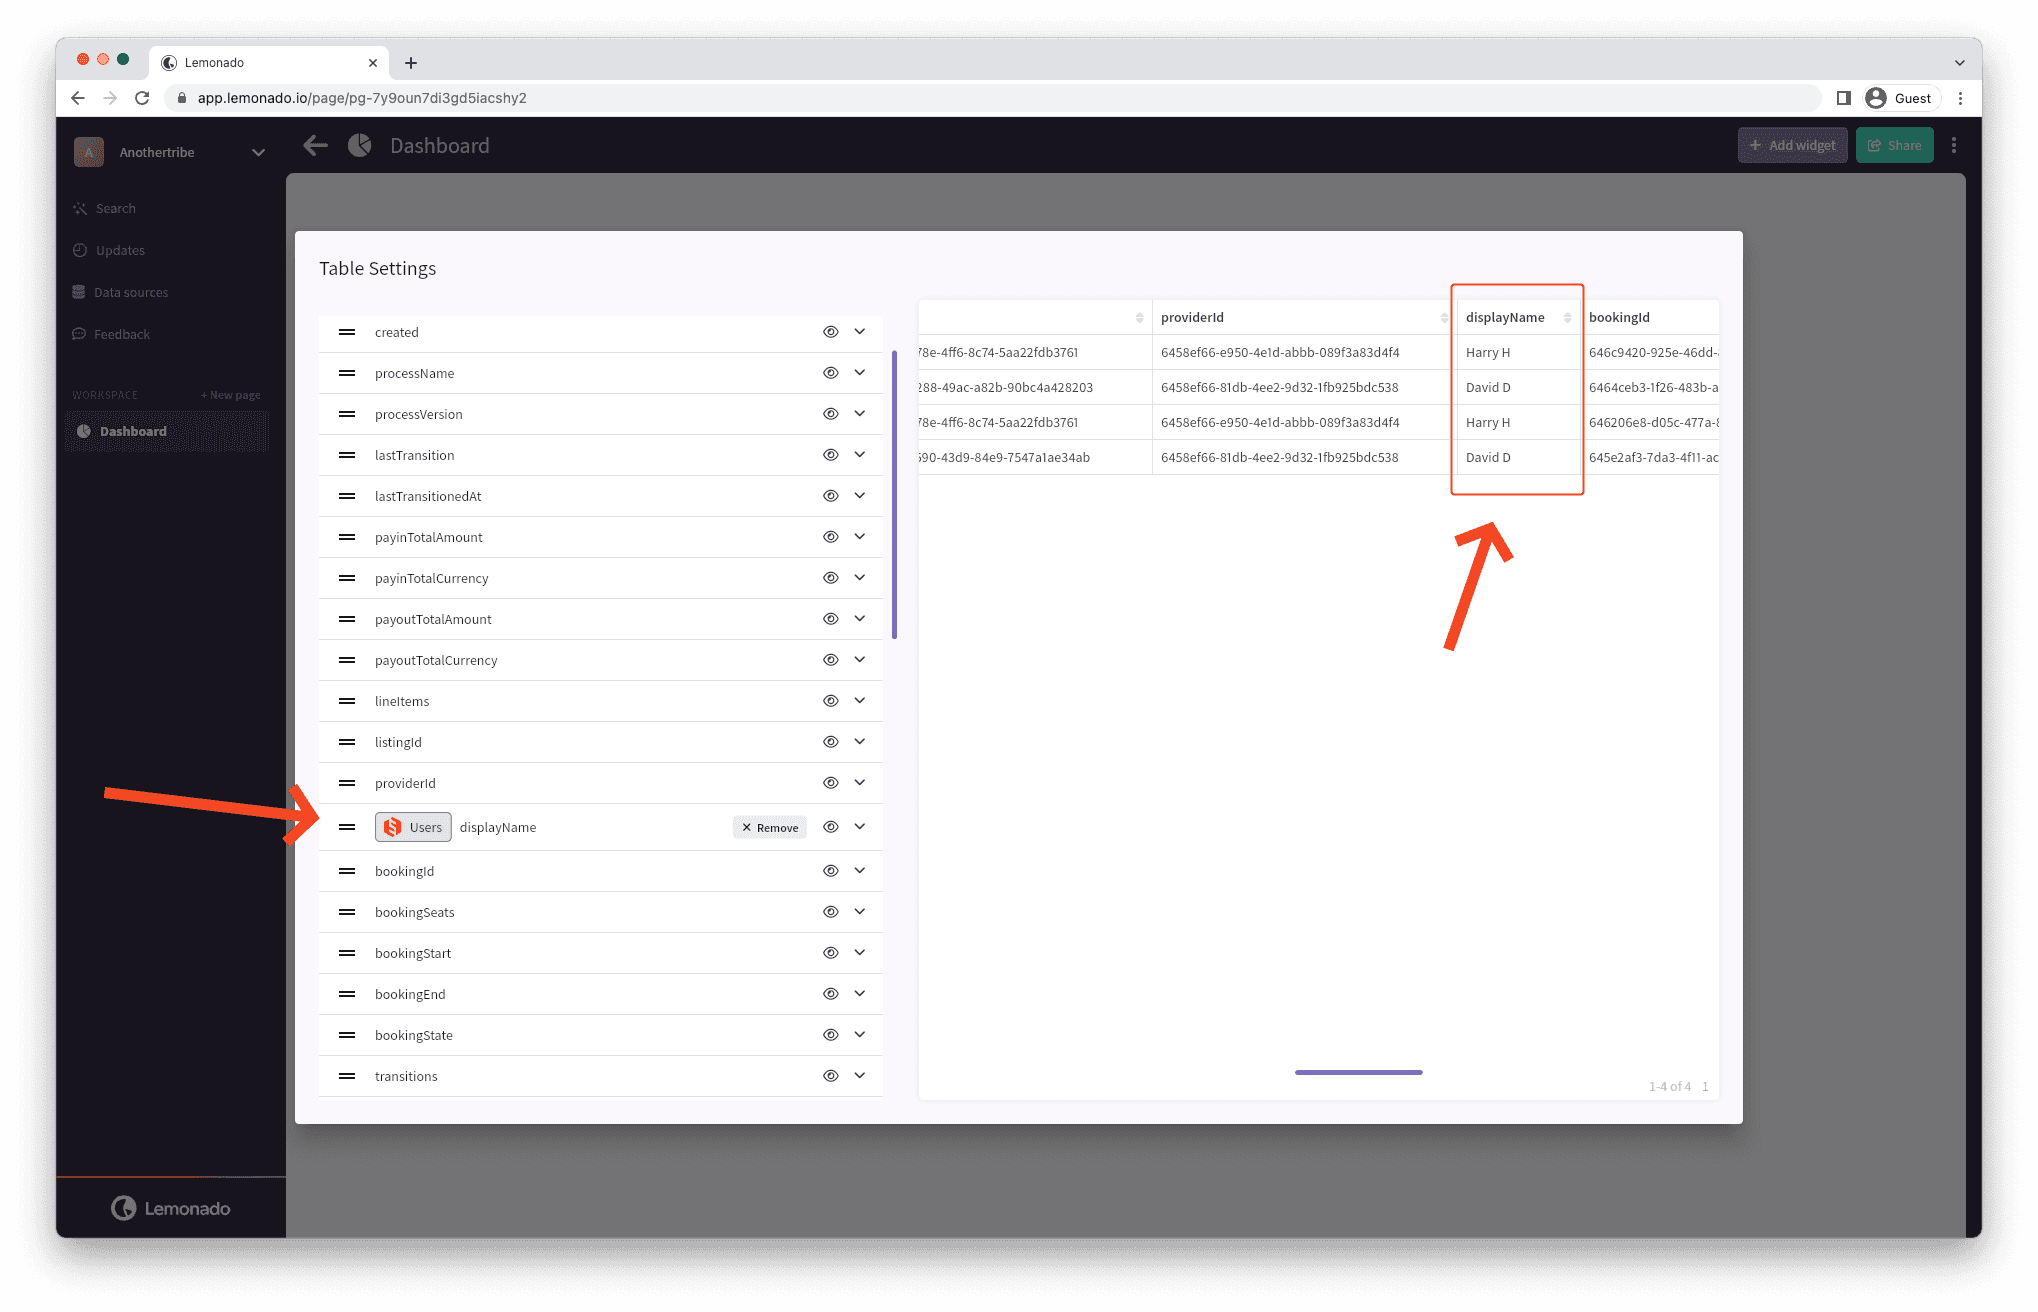
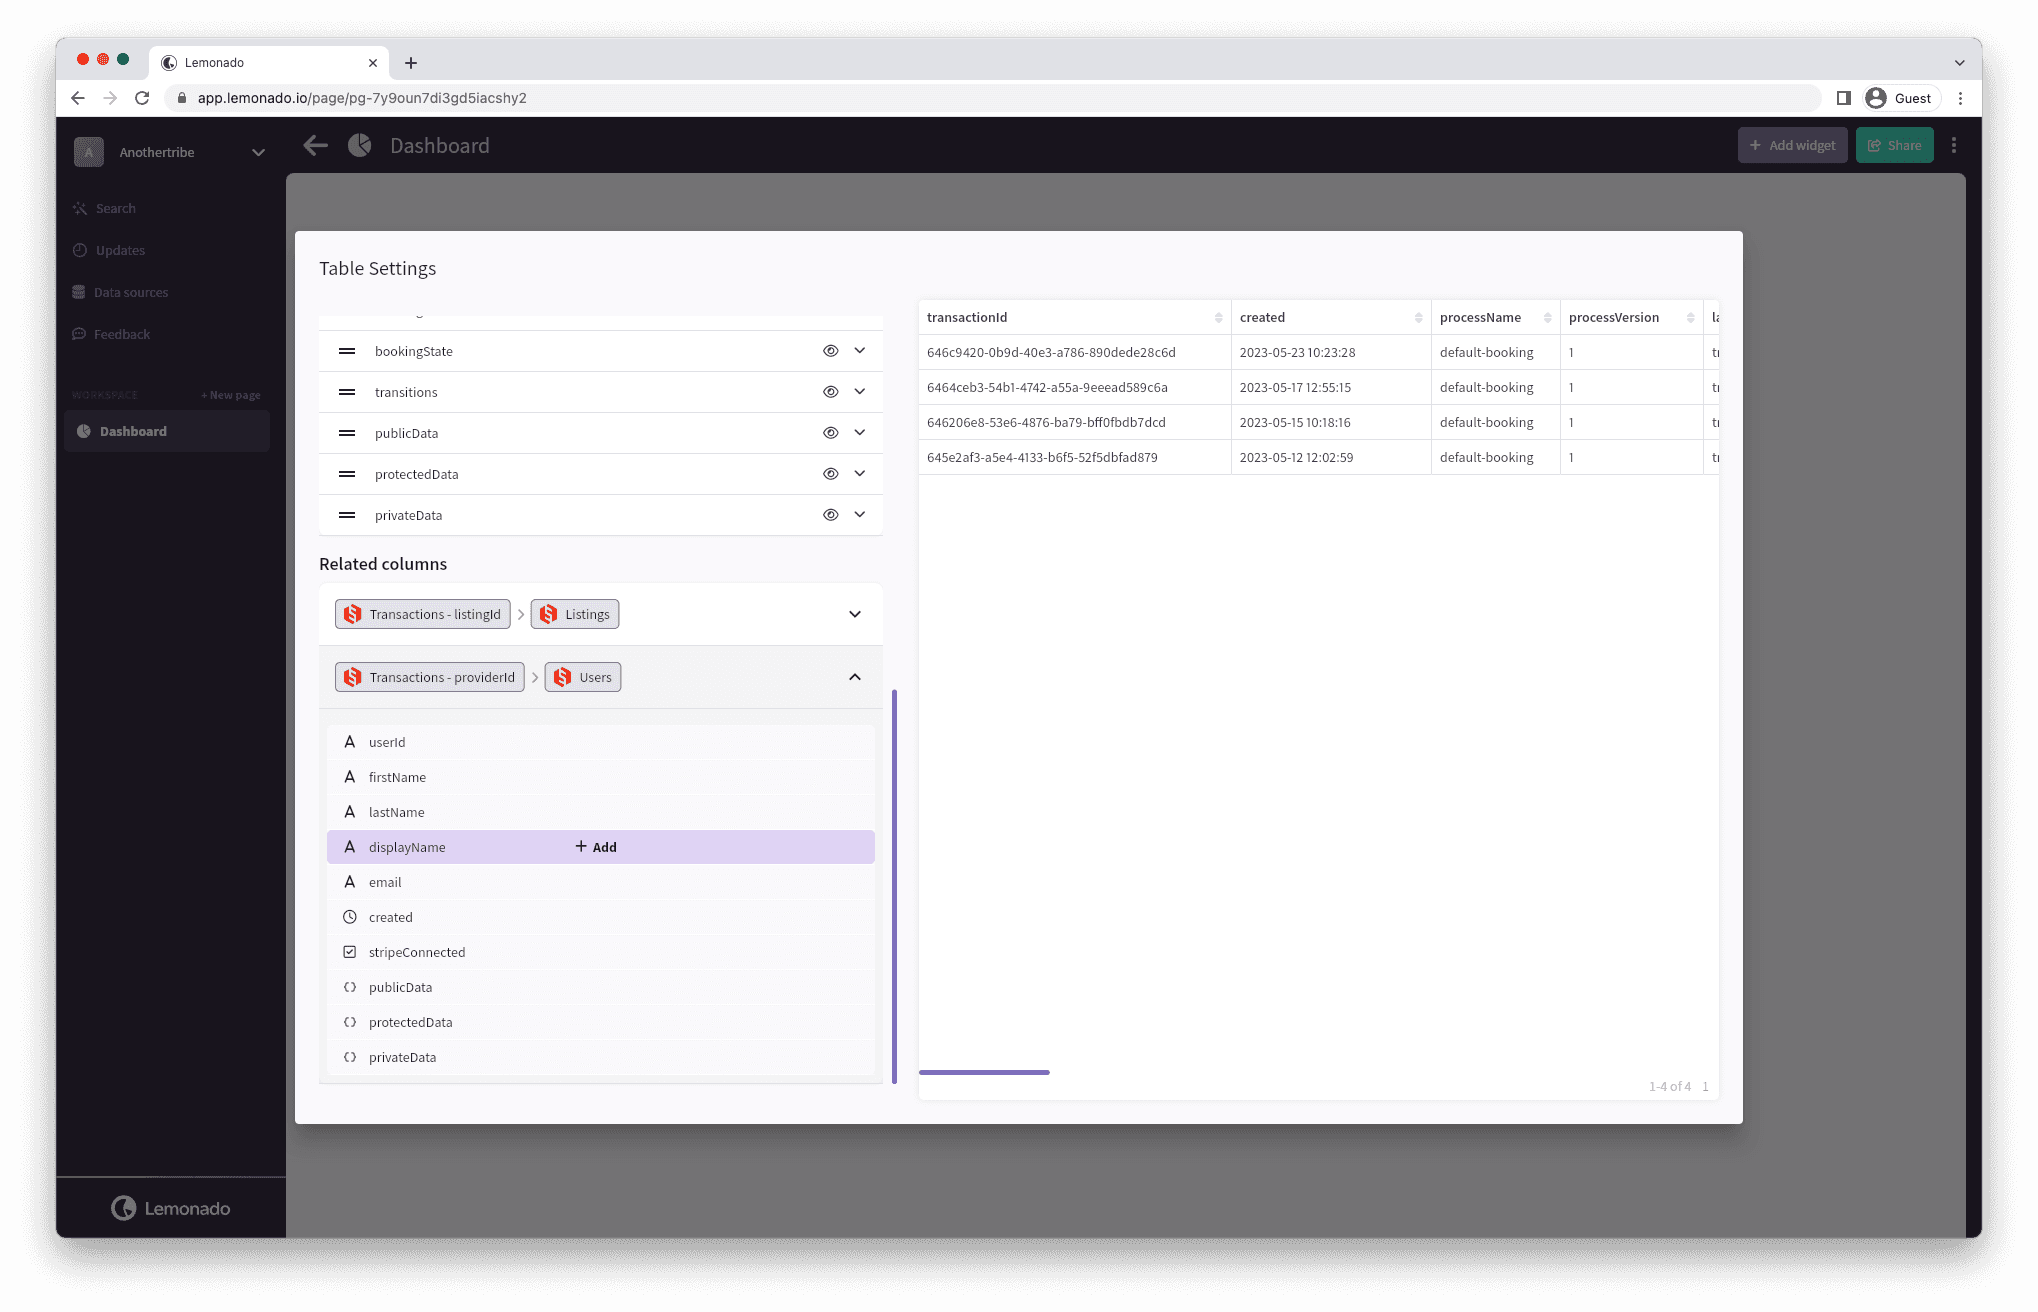
To make it easier to know who has done what transaction, let's add in the providers name next to providerID. Start by scrolling down to related columns and then click add on displayName.
If you'd like you can move the column up so it sits next to providerID.