How to Build Dashboards from PostgreSQL Data

Published April 26, 2025 | 5 minute read
Written by Lane Goedhart
If your product runs on PostgreSQL, you’re already using one of the most powerful open-source databases available. But turning that data into something your team or your customers can actually understand? That’s where things usually slow down.
In this guide, we’ll show you how to connect your Postgres database to Lemonado and go from raw tables to real-time dashboards in just a few minutes. No SQL required. No custom frontends. Just insights exactly where they belong — inside your product.
Why PostgreSQL?
PostgreSQL is the backbone for thousands of modern SaaS applications. It’s reliable, flexible, and built to handle complexity, which makes it ideal for both transactional data and deep analysis.
Here’s why so many teams trust it:
ACID compliance by default
Open source with a strong developer community
Advanced indexing (GIN, GiST) for fast querying
Supports a wide range of data types and structures
Built-in full-text search
Scales easily as your user base grows
MVCC for consistent performance under load
It’s powerful. But without the right tooling, it’s also stuck behind queries and dashboards that only your engineers can build. That’s what we’re fixing.
Connecting PostgreSQL with Lemonado
You don’t need to know SQL or build custom frontend components to turn your PostgreSQL data into usable, shareable dashboards. With Lemonado, it takes just a few minutes to go from raw tables to real insights.
Here’s how to get started:
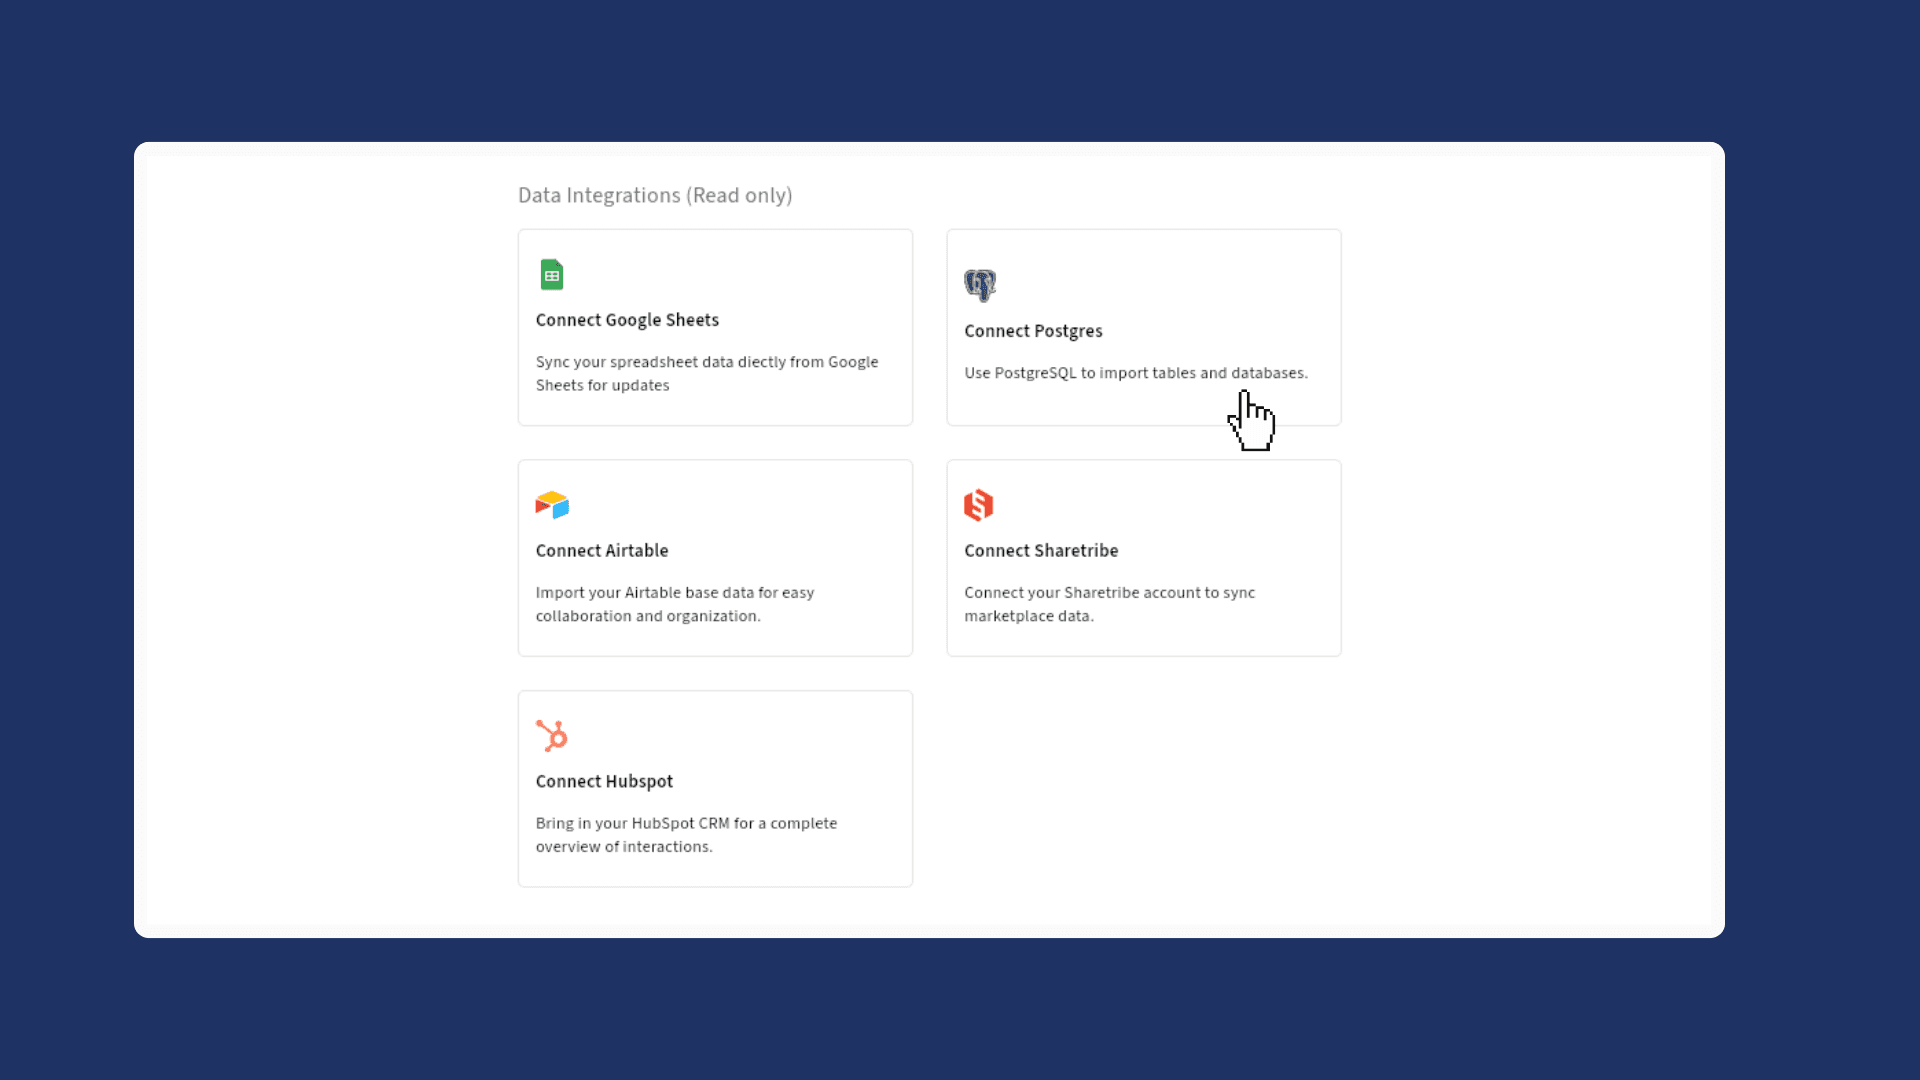
1. Connect Your PostgreSQL Database
Log in to your Lemonado workspace
On the Start page, select PostgreSQL under Data Integrations
Enter your database credentials in the connection fields
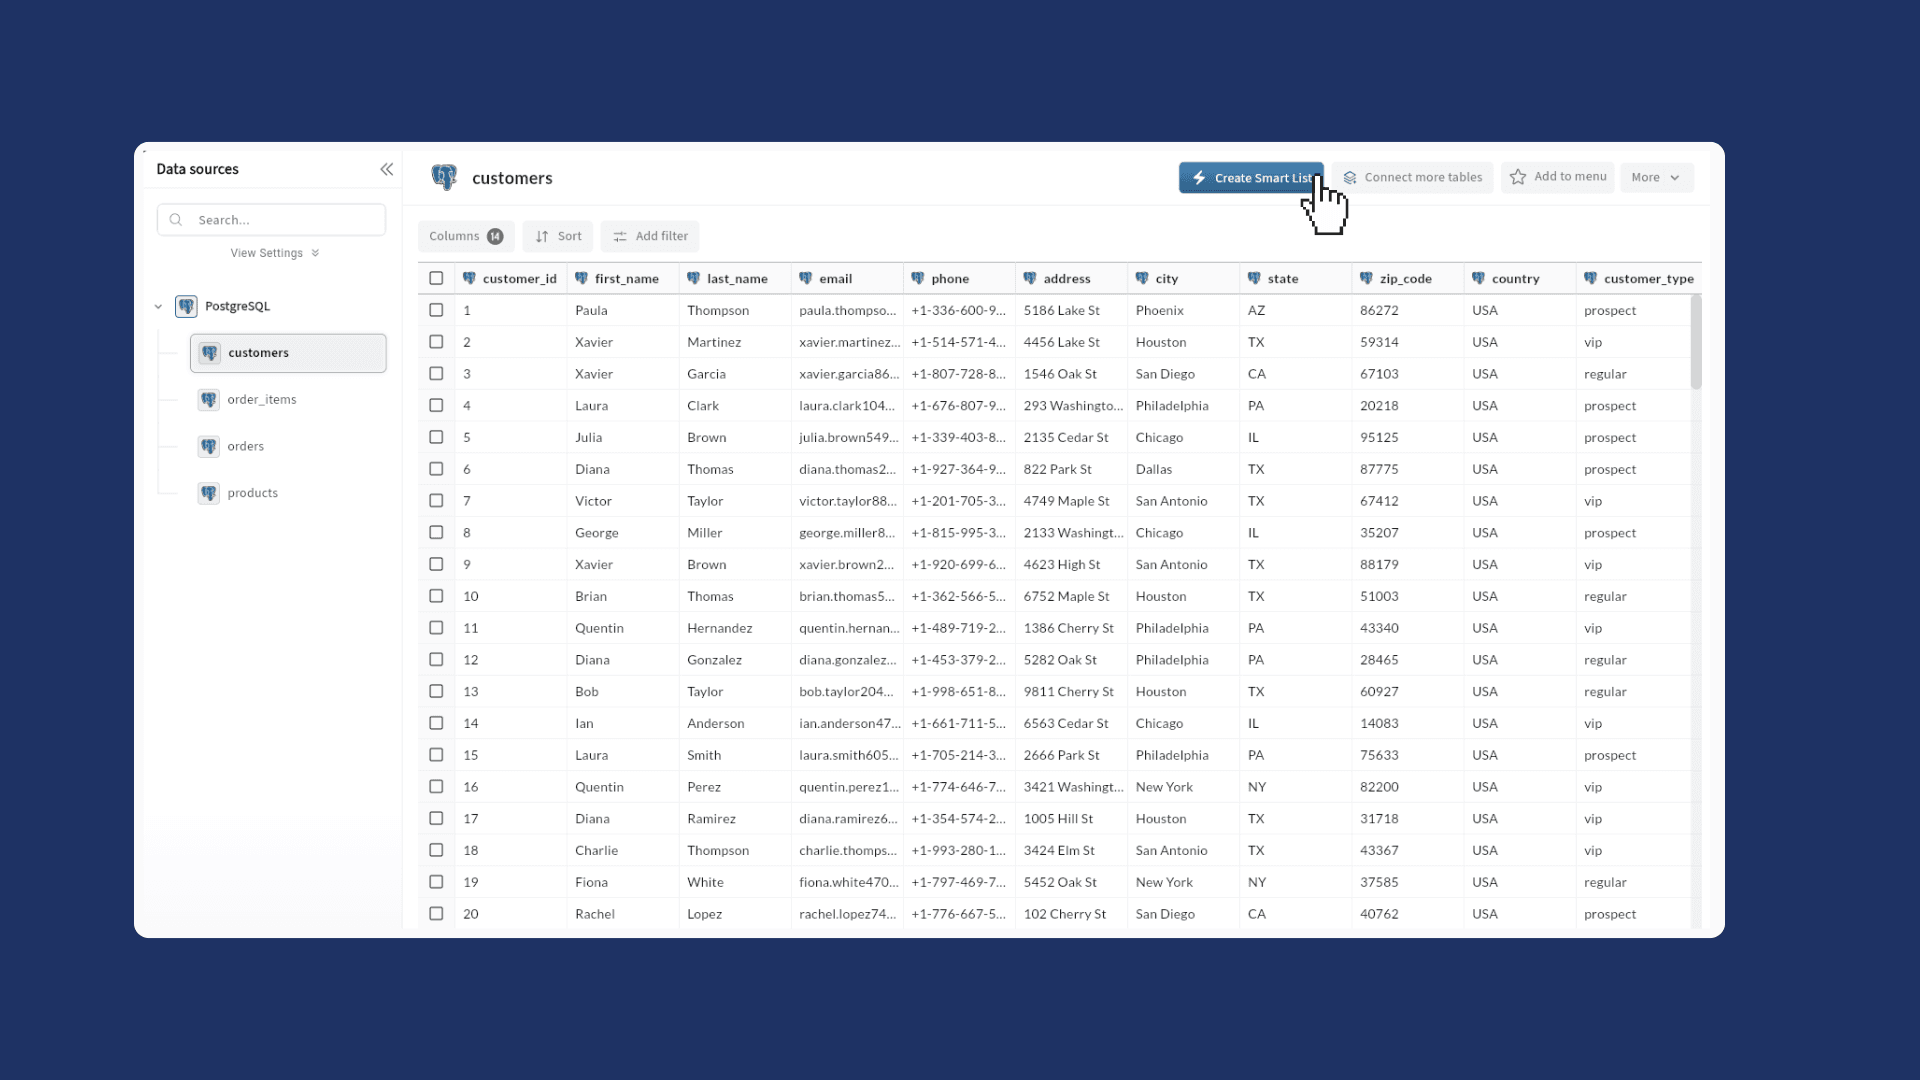
Once verified, Lemonado gives you live access to your data in a clean, table-style view
You’ll see your PostgreSQL tables alongside any other data sources you've added to Lemonado, like Stripe, HubSpot, Google Sheets, or Shopify.
2. Create a Smart List to Filter and Relate Your Data
Before building your dashboard, create a Smart List. This is Lemonado’s way of letting you apply filters, define relationships, and combine data without SQL.
You can:
Filter rows from your PostgreSQL tables
Combine columns from related tables
Automatically link data across sources (for example, connect
user_idfrom Postgres touser_idfrom HubSpot)
This step makes it easier to build dashboards that pull from multiple systems at once.
3. Build Your Dashboard (No SQL Required)
You have two options for building your dashboard, and neither requires writing queries.
Option 1: Ask Lenny, Your AI Assistant
Lenny is Lemonado’s built-in AI. You can describe what you want in plain English, and Lenny will build the widgets and layout for you.
Example Prompt:
Lenny, can you create a chart that shows the number of new customers added each month this year, and add it to my page titled Investor Update?
Lenny will scan your data, create the right widget, apply filters, and place it where it belongs.

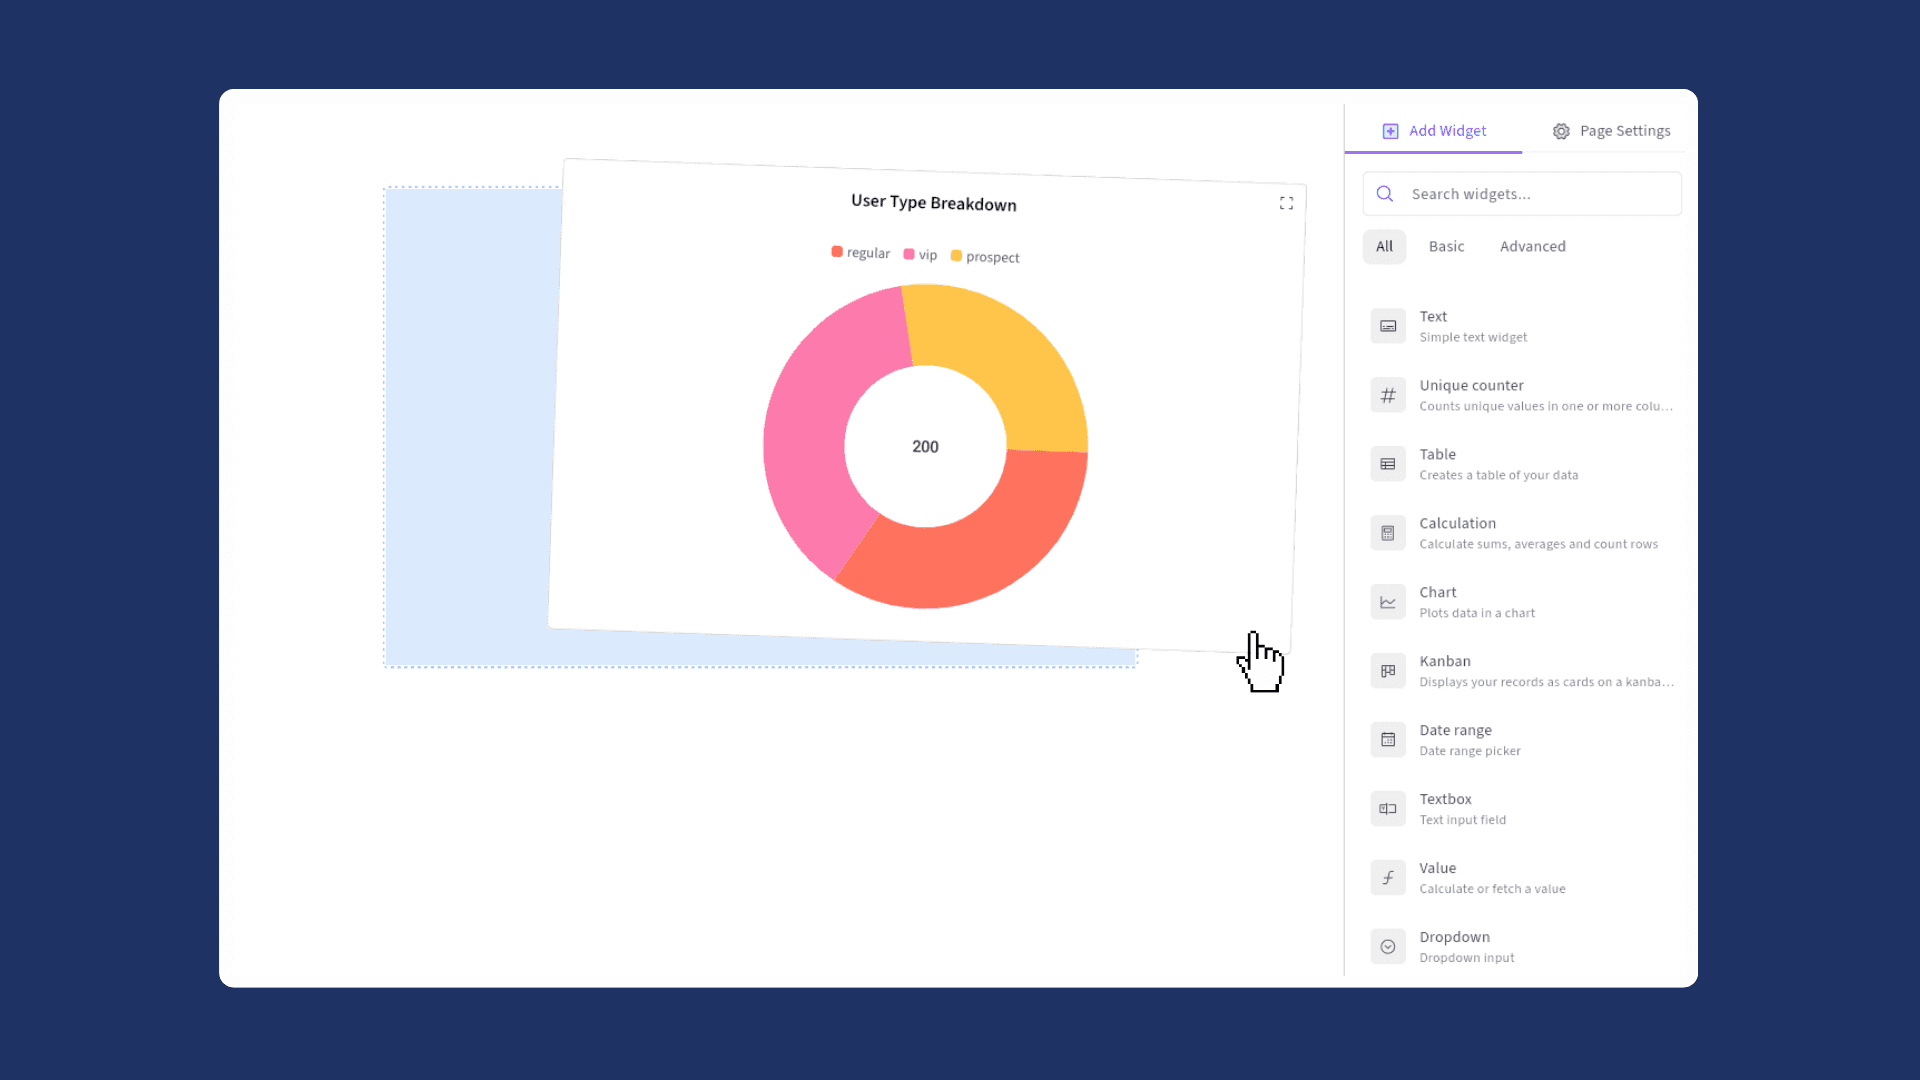
Option 2: Use the Drag-and-Drop Builder
You can also build dashboards manually using Lemonado’s no-code interface.
Click Edit Page in the top right corner
Choose from pre-built widgets like tables, charts, metrics, and counters
Connect each widget to a data source or Smart List
Apply filters, select date ranges, and style your layout
Example Use Case:
To count new users from the last 30 days:
Select a Calculation widget
Point it to your PostgreSQL table (for example,
users)Choose a column (such as
id)Apply an aggregate (count)
Filter the data on
created_atand select "Last 30 Days"
4. Share or Embed Your Dashboard
Once your dashboard is ready:
Generate a secure link to share it with your team
Or copy the embed code and drop it into your SaaS product
Add branding, access filters, or parameter signing if needed
You now have a live, interactive dashboard running on your Postgres data. No manual exports. No engineering tickets. Just clear visibility into what matters.
Lemonado lets you explore your PostgreSQL data, define success metrics, and turn them into live dashboards that anyone can understand and use. Whether you're building internal reports or customer-facing dashboards, it’s built to help you move fast and deliver clarity.
Click here to connect your PostgreSQL database.